summary [artifact]
Table of Contents
![]()
A SUMMARY-type anvi’o artifact. This artifact is typically generated, used, and/or exported by anvi’o (and not provided by the user)..
🔙 To the main page of anvi’o programs and artifacts.
Provided by
Required or used by
There are no anvi’o tools that use or require this artifact directly, which means it is most likely an end-product for the user.
Description
This is the output of the program anvi-summarize and it comprehensively describes the data stored in a contigs-db and profile-db pair.
By default, this will be a directory called SUMMARY that will contain some subdirectories, a text file that summarizes your bins, and an html file that formats the data in the summary nicely.
The bin summary
By default, this is stored in a tab-delimited matrix called bins_summary.txt. In this matrix, the rows represent the bins in your profile-db. The columns represent the following from left to right: the bin name, the taxon ID (if calculated), the toal number of nucleotides in the bin, the toal number of contigs in the bin, the N50 statistic (see the page for anvi-display-contigs-stats), the GC content, and the completition and redundency.
Three subdirectories
The subdirectories in the SUMMARY folder are as follows:
-
bin_by_bin: this directory contains a subdirectory for each of your bins. Each of these subdirectories contains various information about the contents of that bin. For example, you get a fasta file that contains the sequences of all of the contigs in your bin, various statistics for that bin (ex coverage and detection) across each of your samples in tab-delimited matrices, and fasta files that contain only sequences of a specific taxa (ex only Archaea sequences) -
bins_across_samples: this directory contains various text files, each of which describes a single statistic about your bins across all of your samples. Most of these files are tab-delimited matrices where each row represents a bin and each column describes one of your samples; each cell describes the value of a single stastic like mean coverage, relative abundance, or variaiblity. The only files that are not formatted this way are those describing the hmm-hits in the database, which only give total counts for hmm-hits of a certain kind in your bins and don’t break these results down by sample. -
misc_data_layersormisc_data_items: this data contains all of the misc-data-items and misc-data-layers stored in your database pair, formatted in misc-data-items-txt and misc-data-layers-txt files respectively.
The HTML document
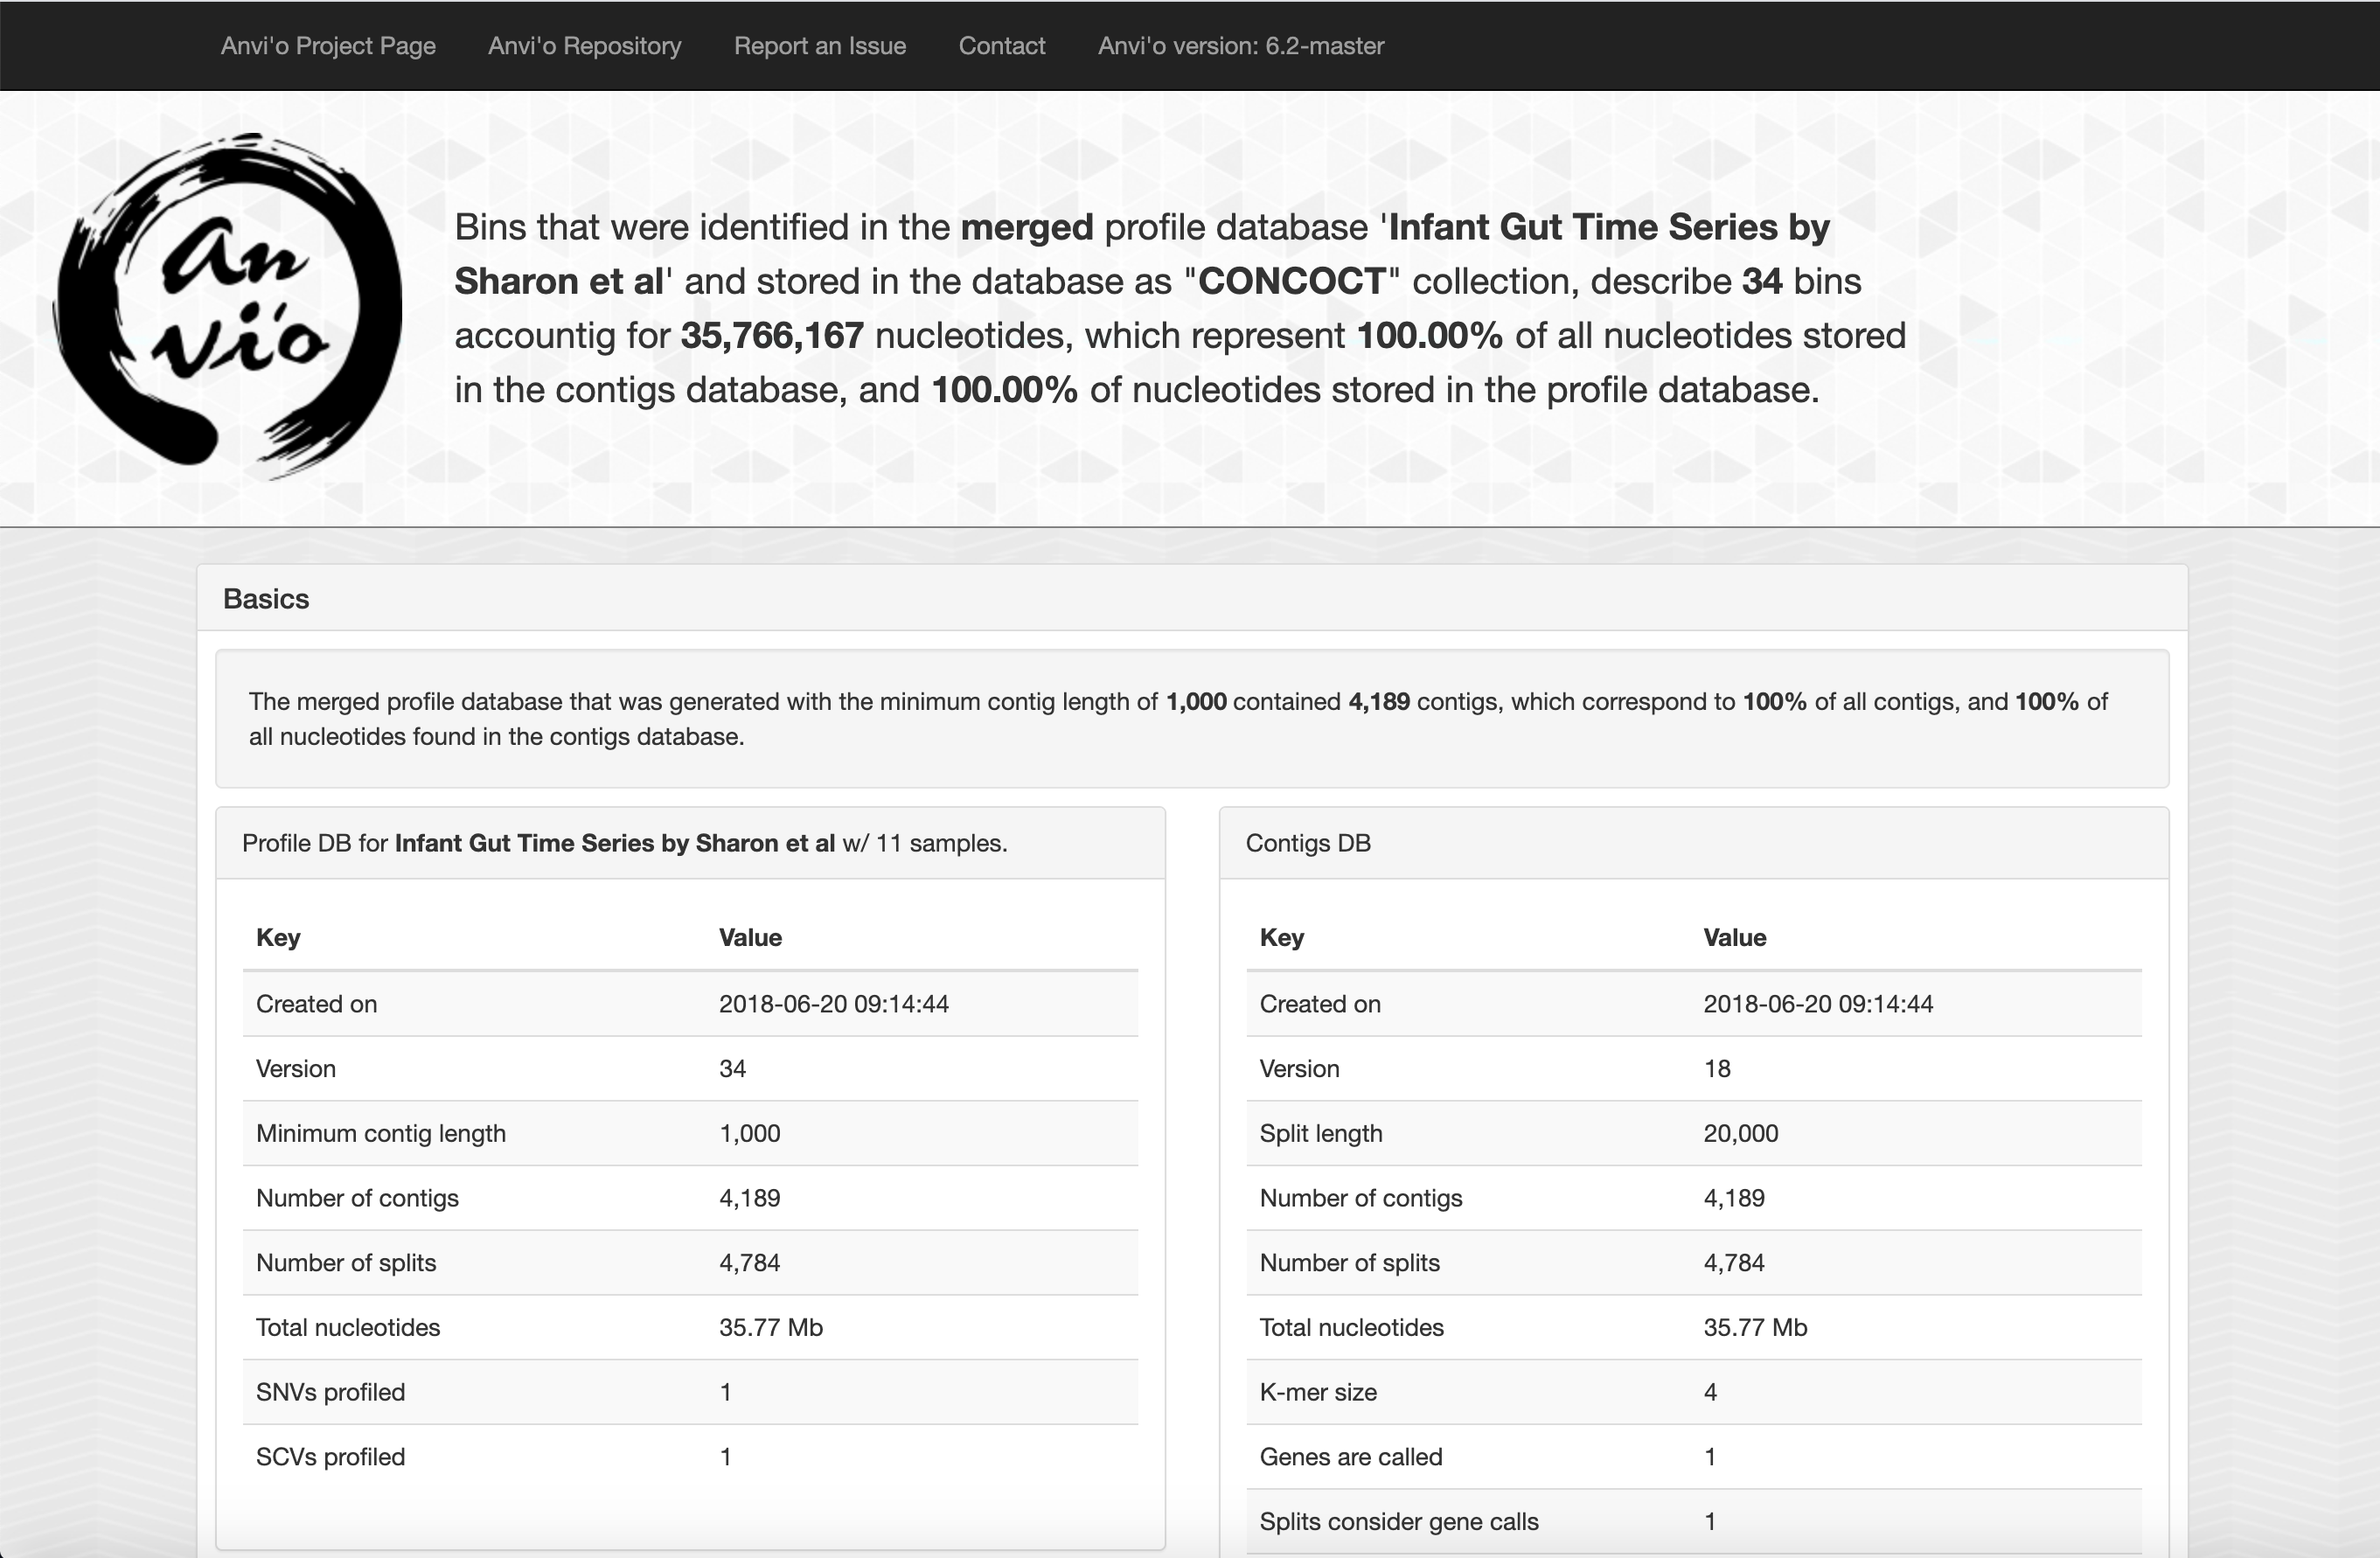
When opened (usualy with an internet browser), you should see a page that looks somewhat like this.

The top bar provides links to various anvi’o resources, while the large text at the top provides an overall summary of your data, including the name, size, and format of the database.
Following this, basic information about your databases are listed, such as the parameters used to create the databases and information about when they were created.
After this, several sections are listed:
-
The description of your database (which you can change with anvi-update-db-description)
-
“Summary of Bins”, which contains the information from the
bin_by_binsubdirectory (but in a format that ‘s a little easier on the eyes)
-“Across Samples”, which contains the information from the bins_across_samples subdirectory. Here, you can change which metric you’re looking at from the tabs at the top of this section (i.e. under the “Across Samples” header but above the displayed data)
-“Percent Recruitment”: This is also from the bins_across_samples subdirectory. It describes the percent of mapped reads in each sample that mapped to splits within each bin.
-“Gene Calls”: lists all of the gene calls in your database by bin, including their functional annotation and coverage and detectin values.
-“Hits for non-single-copy gene HMM profiles”: This is also from the bins_across_samples subdirectory. The first table displays the total number of hits in each bin, while the table underneath provides a breakdown of those HMM hits. Note that each cell in the first table is a link that leads to a fasta file that contains only the relevant sequences.
-“Misc Data”: contains the information from the misc_data_layers or misc_data_items subdirectories.
Edit this file to update this information.