anvi-display-contigs-stats [program]
Table of Contents
Start the anvi'o interactive interactive for viewing or comparing contigs statistics.
🔙 To the main page of anvi’o programs and artifacts.
Authors


Can consume
Can provide
Usage
This program helps you make sense of contigs in one or more contigs-dbs.
Working with single or multiple contigs databases
You can use this program on a single contigs database the following way:
anvi-display-contigs-stats CONTIGS-01.db
Alternatively, you may use it to compare multiple contigs databases:
anvi-display-contigs-stats CONTIGS-01.db \ CONTIGS-02.db \ (…) CONTIGS-XX.db
If you are comparing multiple, each contigs databse will become an individual column in all outputs.
Interactive output
If you run this program on an anvi’o contigs database with default parameters,
anvi-display-contigs-stats contigs-db
it will open an interactive interface that looks like this:
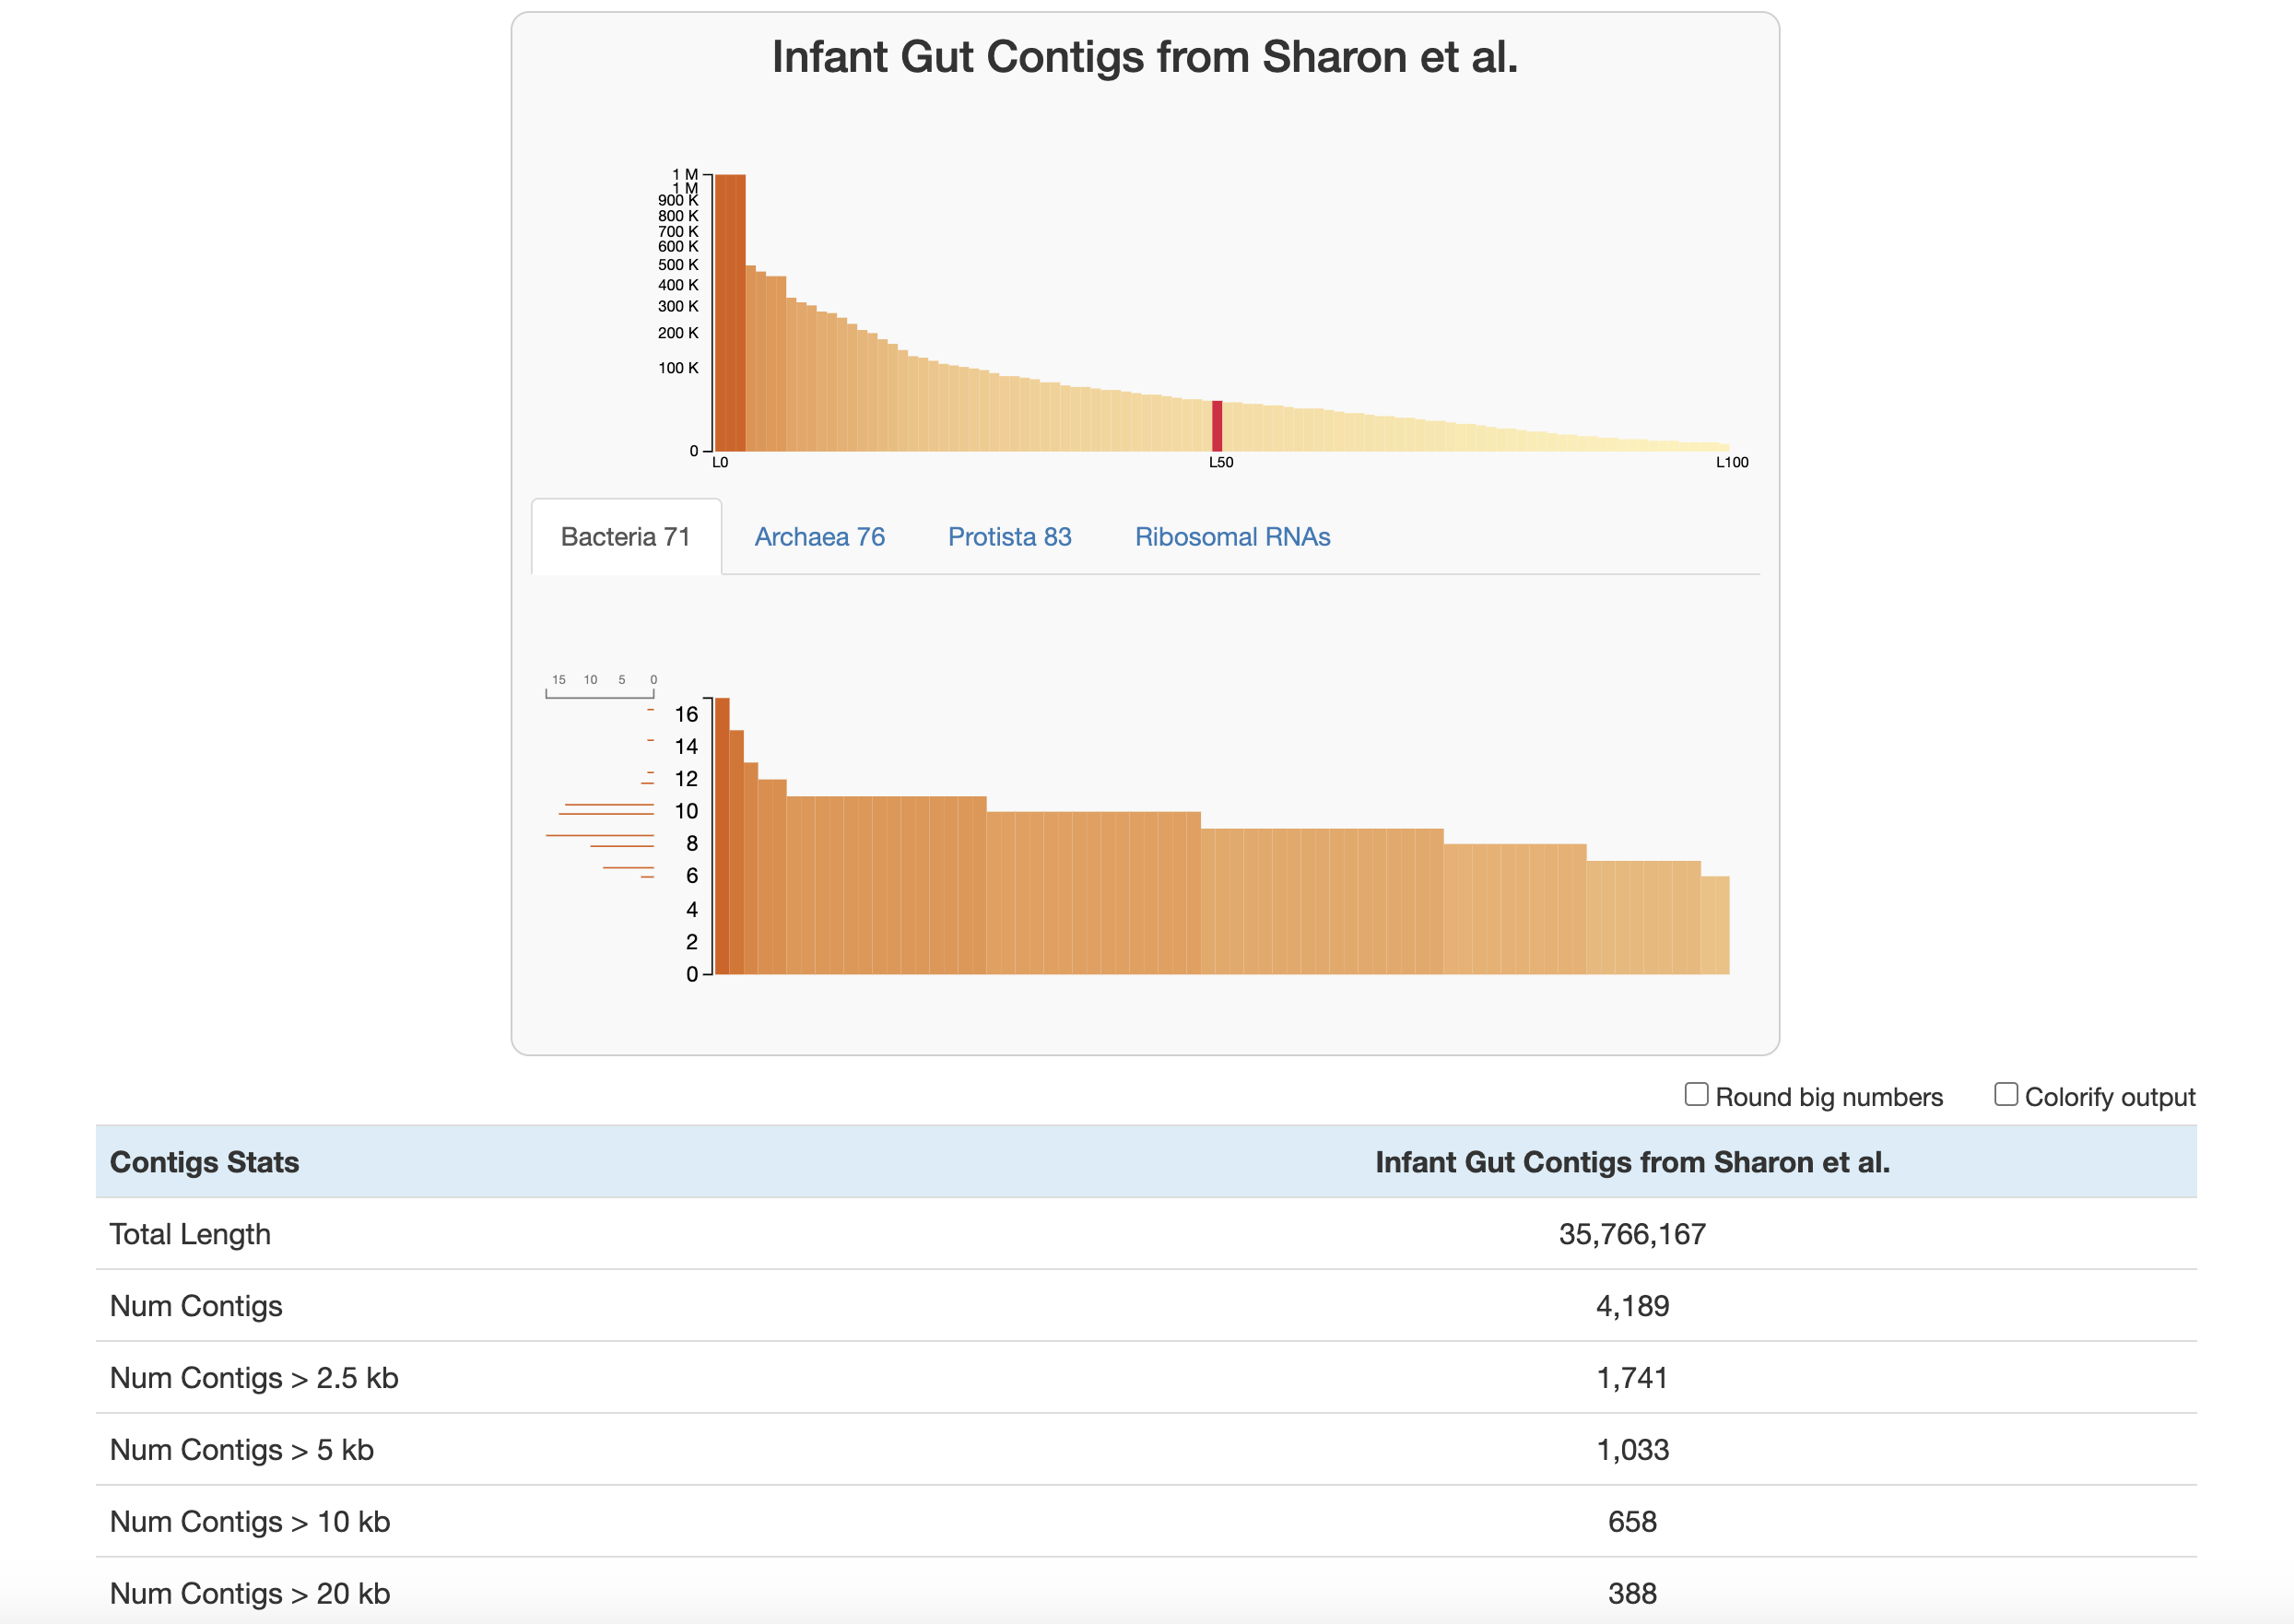
At the top of the page are two graphs:
-
The bars in the top graph represent every integer N and L statistic from 1 to 100. The y-axis is the respective N length and the x-axis is the percentage of the total dataset looked at (the exact L and N values can be seen by hovering over each bar). In other words, if you had sorted your contigs by length (from longest to shortest), and walked through each one, every time you had seen another 1 percent of your total dataset, you would add a bar to the graph showing the number of contigs that you had seen (the L statistic) and the length of the one you were looking at at the moment (the N statistic).
-
The lower part of the graph tells you about which HMM hits your contigs database has. Each column is a gene in a specific hmm-source, and the graph tells you how many hits each gene has in your data. (Hover your mouse over the graph to see the specifics of each gene.) The sidebar shows you how many of the genes in this graph were seen exactly that many times. For example, in the graph above, for the Bacteria_71 hmm-source, a lot of genes were detected 9-11 times, so those bars are longer. This helps you estimate about how many of these genomes there are in your contigs database (so here, there is likely around 9-11 bacteria genomes in this contigs database).
Below the graphs are the contigs stats which are displayed in the following order:
- The total length of your contigs in nucleotides
- The number of contigs in your database
- The number of contigs that are of varying lengths. (for example “Num Contigs > 2.5 kb” gives you the number of contigs that are longer than 2500 base pairs)
- The length of the longest and shortest contig in your database in nucleotides
- The number of genes in your contigs (as predicted by Prodigal)
- L50, L75, L90: If you ordered the contigs in your database from longest to shortest, these stats describe the number of contigs you would need to go through before you had looked at a certain percent of a genome. For example, L50 describes the number of contigs you would have to go through before you reached 50 percent of the entire dataset.
- N50, N75, N90: If you ordered the contigs in your database from longest to shortest, these stats describe the length of the contig you would be looking when you had looked at a certain percent of a genome. For example, N50 describes the length of contig you would be on when you reached 50 percent of the entire genome length.
- The number of HMM hits in your contigs. This goes through every hmm-source and gives the number of hits its genes had in all of your contigs. Basically, this is the number of hits that is given in the lower graph at the top of the page.
- The number of genomes that anvi’o predicts are in your sample, based on how many hits the single copy core genes got from the various hmm-sources. See the description of the lower graph above, or this blog post for more information.
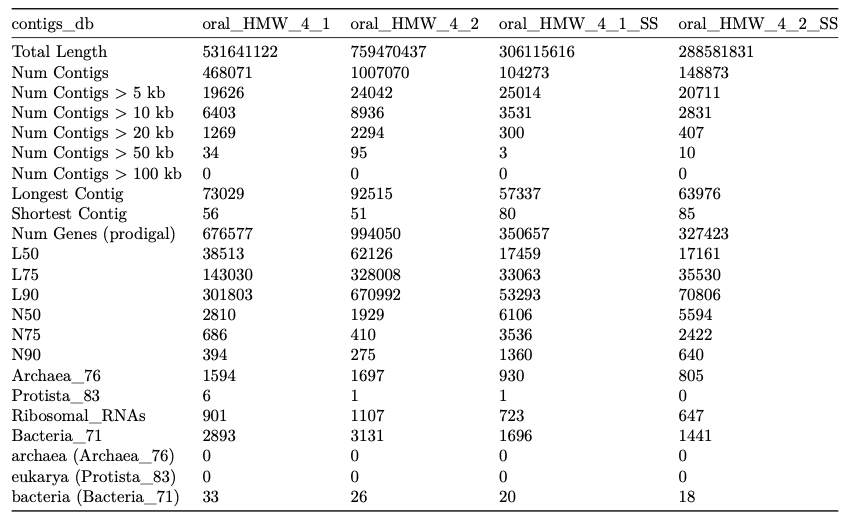
Text output
If you wish to report contigs-db stats as a supplementary table, a text output will be much more appropriate. If you add the flag --report-as-text anvi’o will not attempt to initiate an interactive interface, and instead will report the stats as a TAB-delmited file:
anvi-display-contigs-stats contigs-db \ --report-as-text \ -o OUTPUT_FILE_NAME.txt
There is also another flag you can add to get the output formatted as markdown, which makes it easier to copy-paste to GitHub or other markdown-friendly services. This is how you get a markdown output instead:
anvi-display-contigs-stats contigs-db \ --report-as-text \ --as-markdown \ -o OUTPUT_FILE_NAME.md
Here is an example output:
| contigs_db | oral_HMW_4_1 | oral_HMW_4_2 | oral_HMW_4_1_SS | oral_HMW_4_2_SS |
|---|---|---|---|---|
| Total Length | 531641122 | 759470437 | 306115616 | 288581831 |
| Num Contigs | 468071 | 1007070 | 104273 | 148873 |
| Num Contigs > 5 kb | 19626 | 24042 | 25014 | 20711 |
| Num Contigs > 10 kb | 6403 | 8936 | 3531 | 2831 |
| Num Contigs > 20 kb | 1269 | 2294 | 300 | 407 |
| Num Contigs > 50 kb | 34 | 95 | 3 | 10 |
| Num Contigs > 100 kb | 0 | 0 | 0 | 0 |
| Longest Contig | 73029 | 92515 | 57337 | 63976 |
| Shortest Contig | 56 | 51 | 80 | 85 |
| Num Genes (prodigal) | 676577 | 994050 | 350657 | 327423 |
| L50 | 38513 | 62126 | 17459 | 17161 |
| L75 | 143030 | 328008 | 33063 | 35530 |
| L90 | 301803 | 670992 | 53293 | 70806 |
| N50 | 2810 | 1929 | 6106 | 5594 |
| N75 | 686 | 410 | 3536 | 2422 |
| N90 | 394 | 275 | 1360 | 640 |
| Archaea_76 | 1594 | 1697 | 930 | 805 |
| Protista_83 | 6 | 1 | 1 | 0 |
| Ribosomal_RNAs | 901 | 1107 | 723 | 647 |
| Bacteria_71 | 2893 | 3131 | 1696 | 1441 |
| archaea (Archaea_76) | 0 | 0 | 0 | 0 |
| eukarya (Protista_83) | 0 | 0 | 0 | 0 |
| bacteria (Bacteria_71) | 33 | 26 | 20 | 18 |
You can easily convert the markdown output into PDF or HTML pages using pandoc. For instance running the following command in the previous output,
pandoc -V geometry:landscape \
       OUTPUT_FILE_NAME.md
       -o OUTPUT_FILE_NAME.pdf
will results in a PDF file that looks like this:
Edit this file to update this information.
Additional Resources
Are you aware of resources that may help users better understand the utility of this program? Please feel free to edit this file on GitHub. If you are not sure how to do that, find the __resources__ tag in this file to see an example.