anvi-interactive [program]
Table of Contents
- Can provide
- Can consume
- Usage
- Running anvi-interactive on a profile database
- How to visualize things when you don’t have a hierarchical clustering of your contigs?
- Visualizing bins instead of contigs
- Visualizing genes instead of contigs
- Running anvi-interactive in manual mode
- Extending anvi’o displays
- Visualization Settings
- Password protection
- Quick solutions for network problems
- Other things
- Additional Resources
Start an anvi'o server for the interactive interface.
Go back to the main page of anvi’o programs and artifacts.
Can provide
collection ![]() bin
bin ![]() interactive
interactive ![]() svg
svg ![]()
Can consume
profile-db ![]() single-profile-db
single-profile-db ![]() contigs-db
contigs-db ![]() genes-db
genes-db ![]() bin
bin ![]() view-data
view-data ![]() dendrogram
dendrogram ![]() phylogeny
phylogeny ![]()
Usage
Initiates an interactive environment in your default browser.
Although it is generally associated with the typical concentric circles of ‘oimcs data, the anvi’o interactive interface has many forms and off Anvi’o. Anvi’oers a vast amount of functionality, from manual reconstruction of genomes from metagenomes to refinement of metagenome-assembled genomes, displaying nucleotide-level coverage patterns, single-nucleotide variants, pangenomes, phylogenomic trees, and more. While the circular display is the default method for data presentation, you can also display your data in a rectangular from (as seen here).
In fact, the interface has many of its own blog posts, including a pretty comprehensive introductory tutorial here and a breakdown of its data types here.
Here, we’ll go through some things that the anvi’o interactive interface is capable of through this program. More information about most of this can be found by calling anvi-interactive -h or by checking out the additional resources at the bottom of this page.
Please makes sure you are familiar with the terminology that describes various parts of a given display, which are explained in the interactive artifact:
Running anvi-interactive on a profile database
One of the simplest ways to run the interactive interface (especially useful for manual binning) is just providing an anvi’o profile database and an anvi’o contigs database:
anvi-interactive -p profile-db \ -c contigs-db
For the central tree to display correctly, you’ll need to have run hierarchical clustering at some point while making your profile database (either during anvi-merge, or, if this is a single-profile-db, while running anvi-profile). It is also possible to provide a phylogenetic tree or a clustering dendrogram from the command line using the --tree parameter.
If you do not have a state stored in your profile database named default, you will need to click the “Draw” button for anvi’o to provide you with an interactive display of your data.
How to visualize things when you don’t have a hierarchical clustering of your contigs?
Typically the interactive displays that will be initiated with anvi-interactive will require an items order to display all your contigs. There are multiple ways for anvi’o to generate dendrograms.
Some advanced information you should feel free to skip: anvi’o uses a set of clustering-configuration files to decide which sources of data to use to cluster items. These recipes are essentially a set of configuration files for anvi’o to learn which information to use from contigs-db, profile-db, or pan-db type databases.
Some of the programs that generate dendrograms include anvi-merge, anvi-profile, and anvi-experimental-organization. But since hierarchical clustering is an extremely demanding process, anvi’o will skip this step during anvi-merge if there are more than 20,000 splits n the database. This is because the computational complexity of this process will get less and less feasible with increasing number of splits. You can force anvi’o to try to cluster your splits regardless of how many of them there are there by using the flag --enforce-hierarchical-clustering. However, we strongly advice against it especially if you have more than 30,000 splits since your process will likely to be killed by the operating system, or take a very very long time to finish (plus, if you have that many splits the performance of the interactive interface will be very low).
What happens if you don’t have a hierarchical clustering dendrogram, but you still wish to have an overall understanding of your data, or visualize the coverages of some contigs of interest or any contig at all? There are multiple ways you can do that:
- You can use anvi-inspect to visualize nucleotide- and gene-level coverages and single-nucleotide variants on individual contigs,
- You can use anvi-cluster-contigs to create a collection for your contigs and initiate
anvi-interactivein collection mode (see the subsection “visualizing bins instead of contigs” below. - You can import external binning results using anvi-import-collection, or manually identify contigs of interest, and use anvi-import-collection to create a collection of a smaller number of contigs. You can then use anvi-refine to visualize contigs in a single bin, or use anvi-split to first generate a split profile for your contigs to visualize your smaller dataset using anvi-interactive.
Visualizing bins instead of contigs
By default, when run on a profile database that resulted from a metagenomic workflow, anvi-interactive will initiate each contig as a separate item and organize them based on the clustering dendrograms provided to it (either automatically or by the user). But if there is a collection stored in the profile database, it is also possible to run anvi-interactive on a specific collection, during which anvi’o will use the underlying contig data to calculate summary statistics for each bin before displaying them. In collection mode, each item of your central plot will not represent a contig, but a bin within your collection. This is how the collection mode can be initialized in comparison to the default mode:
anvi-interactive -p profile-db \ -c contigs-db \ -C collection
The clustering of bins in this case based on their distribution across samples will be done automatically on-the-fly. See the note on this mode in the metagenomic workflow for more information.
Visualizing genes instead of contigs
You can also start the interactive interface in “gene mode”, in which each item of the central tree is a gene instead of a split or contig (or bin like in “collection mode”).
To initiate the visualization in gene mode you need the following:
anvi-interactive -p profile-db \ -c contigs-db \ -C collection \ -b bin \ --gene-mode
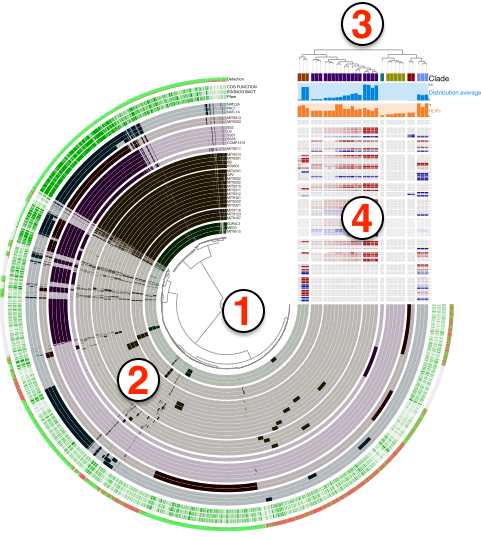
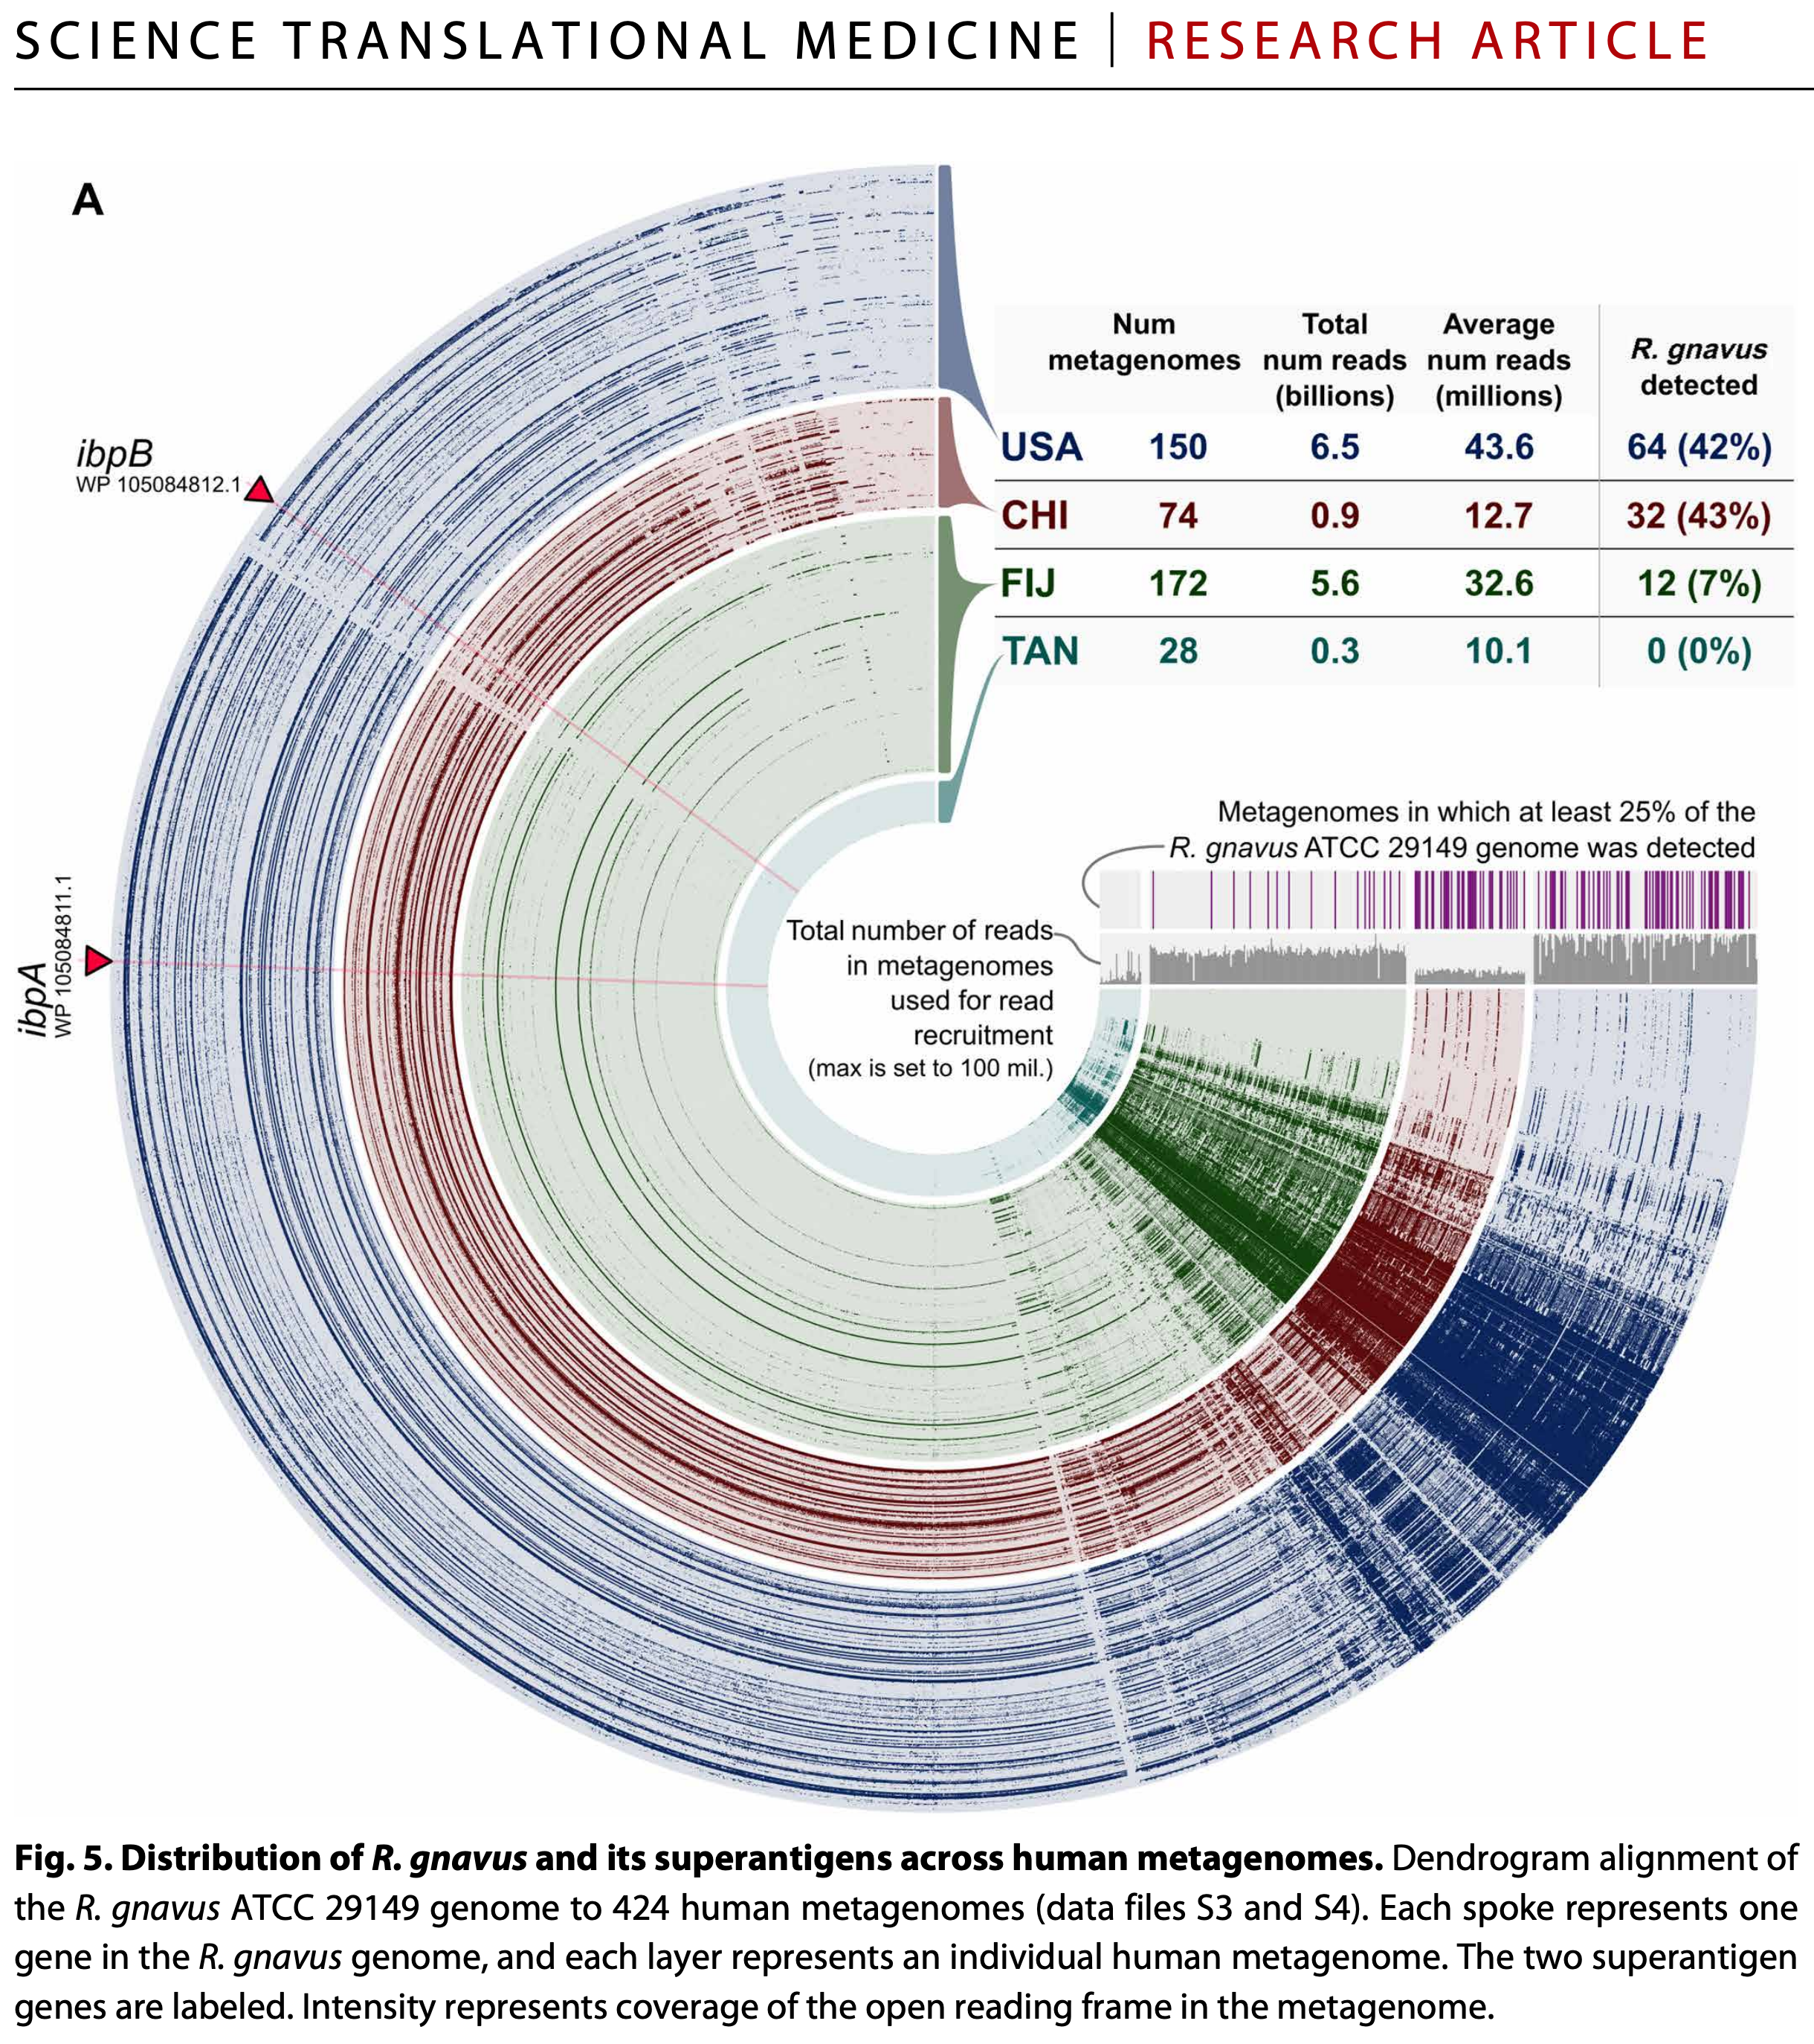
In this view you can order genes based on their distributions patterns across metagenomes (without paying attention to their synteny) or by ordering them based on their synteny in a given genome (without paying attention to their differential distribution). Figure 2 in this paper examples the latter, and Figure 5 in this paper examples the former case, which is also shown below:
You can also visit this page to see another practical example from the Infant Gut tutorial.
Running anvi-interactive in manual mode
You can initiate the anvi’o interactive interface in manual mode to run it on ad hoc data (here is a tutorial on this).
Anvi’o interactive interface is initiated with the flag --manual-mode and then by providing any of the following types of files individually or together:
- a TAB-delimited tabular data,
- a NEWICK formatted tree,
When doing this kind of run, anvi’o does not expect you to have a profile database, but it still needs you to provide a name for it. Anvi’o will simply create an empty one for you so you can store your state or collections in it for reproducibility.
Extending anvi’o displays
You can extend any anvi-interactive display with additional data related to your project through the program anvi-import-misc-data. This article describes a detailed use of this program.
While the use of anvi-import-misc-data is the most effective way to improve anvi’o displays, you can also use the parameter --additional-layers to provide a TAB-delimited file (misc-data-items-txt) that contains additional layers of information over your items.
If you want to add an entirely new view to the interface, you can do that too, as long as you provide a file containing all split names and their associated values. For more information, see the parameter --additional-view.
You can also provide the manual inputs even if you’re using an anvi’o database. For example, if you provide your own NEWICK formatted tree, you will have the option to display it instead of the one in your database.
Visualization Settings
In anvi’o, the visualization settings at a given time are called a state.
To open the interface in a specific state, you can use the --state-autoload flag or by importing a state using anvi-import-state.
You can also customize various aspects of the interactive interface. For example, you can change the preselected view, title, and taxonomic level displayed (for example, showing the class name instead of the genus name). You can also hide outlier single nucleotide variations or open only a specific collection.
Password protection
Use --password-protected flag to limit access to your interactive instances, which is by default will be accessible to anyone on your network.
Quick solutions for network problems
In a typical run, anvi-interactive initiates a local server to which you connect through your browser to visualize data. Which can yield unexpected problems if you are running anvi’o in virtual environments such as Windows Subsystem for Linux. If your browser does not show up, or you get cryptic errors such as “tcgetpgrp failed: Not a tty”, you can always simplify things by manually setting network properties such as --ip-address and --port-number.
For instance you can start an interactive interface the following way:
anvi-interactive -p profile-db \ -c contigs-db \ --ip-address 127.0.0.1 \ --port-number 8901 \ --server-only
Which would not initiate your browser, but then you can open your browser and go to this address to work with the anvi’o interactive interface:
Other things
Viewing your data
You can use this program to look at the available information in your databases, which is very convenient. For example, you can view all of the available
- views (using
--show-views) - states (using
--show-states) - collections (using
--list-collections)
Edit this file to update this information.
Additional Resources
Are you aware of resources that may help users better understand the utility of this program? Please feel free to edit this file on GitHub. If you are not sure how to do that, find the __resources__ tag in this file to see an example.