anvi-get-tlen-dist-from-bam
Report the distribution of template lengths from a BAM file. The purpose of this is to get an idea about the insert size distribution in a BAM file rapidly by summarizing distances between each paired-end read in a given read recruitment experiment..
🔙 To the main page of anvi’o programs and artifacts.
Authors

Requires
Provides
This program does not seem to provide any artifacts. Such programs usually print out some information for you to see or alter some anvi’o artifacts without producing any immediate outputs.
Usage
This program may be useful if you are interested in learning the insert size distribution in a given bam-file.
Example run
The most straightforward way to run the program is the following:
anvi-get-tlen-dist-from-bam bam-file
Here is an example output in the terminal:
BAM file .....................................: ./INVERSION-TEST/CP_R03_CDI_C_07_POST.bam
Number of contigs ............................: 8
Number of reads ..............................: 2,331,062
Minimum template length frequency ............: 10
Maximum template length to consider ..........: 500,000


WARNING
===============================================
Some of your contigs, 2 of 8 to be precise, did not seem to have any template
lenght data. There are many reasons this could happen, including a very high
`--min-tlen-frequency` parameter for BAM files with small number of reads. But
since there are some contigs that seem to have proper paired-end reads with
template lengths, anvi'o will continue reporting and put zeros for contigs that
have no data in output files.

Output file ..................................: TEMPLATE-LENGTH-STATS.txt


✓ anvi-get-tlen-dist-from-bam took 0:00:05.483682
Output file
The program will report a TAB-delimited output file with the following format:
| contig | length | num_reads_considered | mean | mean_Q2Q3 | median | min | max | std |
|---|---|---|---|---|---|---|---|---|
| B_fragilis_ARW016_000000000001 | 5526948 | 2213634 | 367.6 | 392.5 | 393.0 | 32 | 71613 | 663.1 |
| B_fragilis_ARW016_000000000002 | 3905 | 634 | 398.6 | 398.7 | 399.0 | 382 | 415 | 7.926 |
| B_fragilis_ARW016_000000000003 | 4039 | 588 | 397.5 | 397.8 | 398.0 | 380 | 411 | 7.206 |
| B_fragilis_ARW016_000000000004 | 3950 | 524 | 397.4 | 397.2 | 397.0 | 382 | 414 | 7.492 |
| B_fragilis_ARW016_000000000005 | 911 | 0 | ||||||
| B_fragilis_ARW016_000000000006 | 647 | 0 | ||||||
| B_fragilis_ARW016_000000000007 | 12247 | 1860 | 394.9 | 396.7 | 397.0 | 99 | 419 | 23.61 |
| B_fragilis_ARW016_000000000008 | 4861 | 528 | 396.7 | 396.7 | 397.0 | 384 | 410 | 6.746 |
Histogram
If you run the program with the flag --plot-data, it will attempt to plot a histogram for all contigs in the BAM file.
The plotting function requires an additional Python library, plotext, to be installed. While it is not a part of the default anvi’o distirbution, you can install it in your environment by running pip install plotext.
Here is an example run:
anvi-get-tlen-dist-from-bam C09F039427B4.bam \
                            --plot-data
And the result in the terminal:
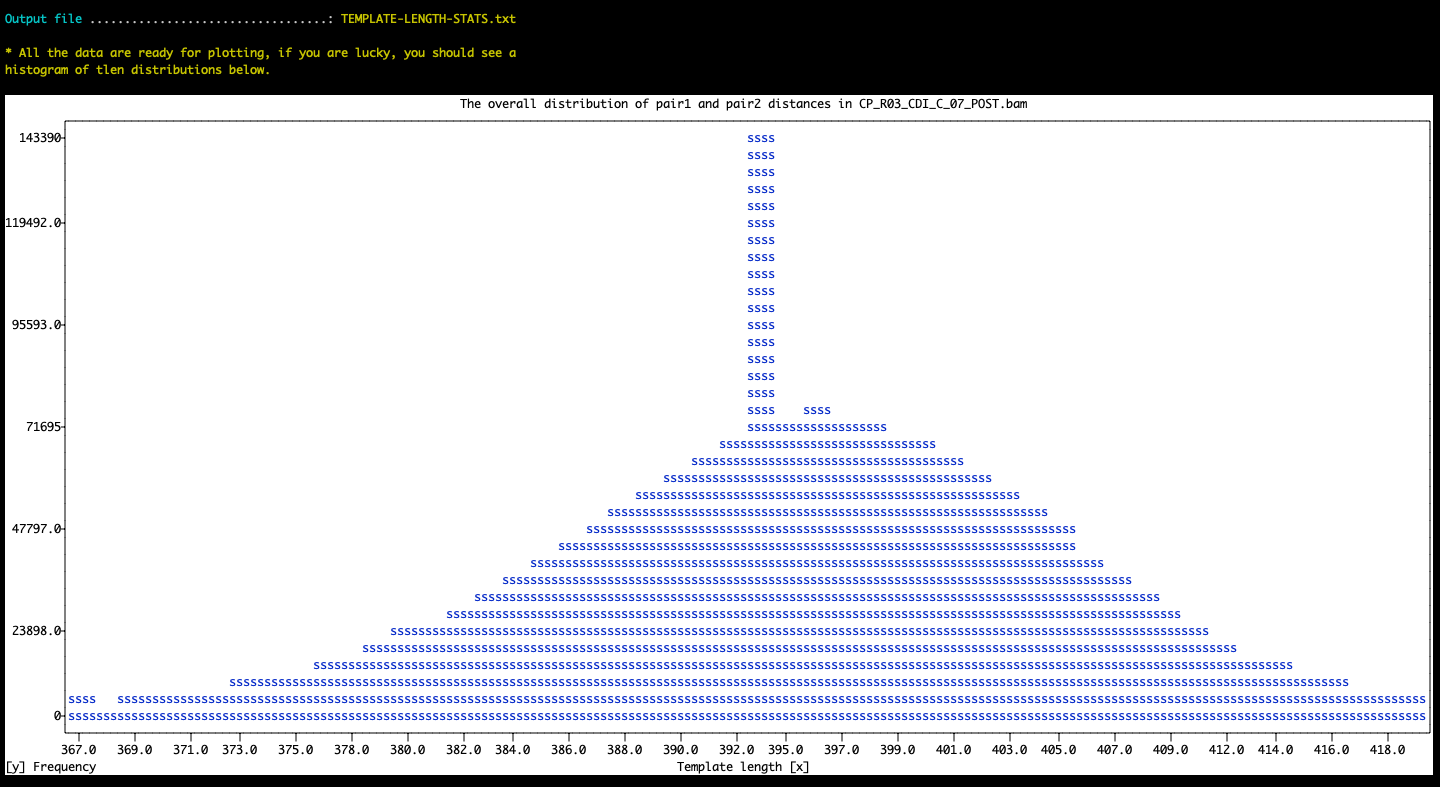
The histogram may require additional filters to avoid skewed displays due to outliers. The parameters --max-template-length-to-consider and/or --min-template-length-frequency may be useful for such adjustments. Please see the help menu for their details.
Edit this file to update this information.
Additional Resources
Are you aware of resources that may help users better understand the utility of this program? Please feel free to edit this file on GitHub. If you are not sure how to do that, find the __resources__ tag in this file to see an example.