interactive [artifact]
Table of Contents
![]()
A DISPLAY-type anvi’o artifact. This artifact is typically generated, used, and/or exported by anvi’o (and not provided by the user)..
Back to the main page of anvi’o programs and artifacts.
Provided by
anvi-display-contigs-stats anvi-display-metabolism anvi-display-pan anvi-display-structure anvi-inspect anvi-interactive anvi-script-snvs-to-interactive
Required or used by
There are no anvi’o tools that use or require this artifact directly, which means it is most likely an end-product for the user.
Description
This page describes general properties of anvi’o interactive displays and programs that offer anvi’o interactive artifacts.
Terminology
Anvi’o uses a simple terminology to address various aspects of interactive displays it produces, such as items, layers, views, orders, and so on. The purpose of this section is to provide some insights into these terminology using the figure below:
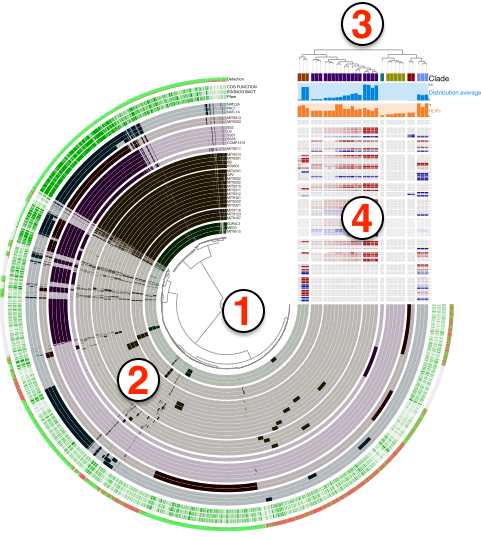
Even though the figure is a product of anvi-display-pan, the general terminology does not change across different interfaces, including the default visualizations of anvi-interactive. Here are the descriptions of numbered areas in the figure:
- The tree denoted by (1) shows the organization of each
item. Items could be contigs, gene clusters, bins, genes, or anything else depending on which mode the anvi’o interactive interface was initiated. The structure that orders items and denoted by (1) in the figure can be a phylogenetic or phylogenomic tree, or a dendrogram produced by a hierarchical clustering algorithm. In addition, there may be nothing there, if the user has requested or set a linear items order through misc-data-items-order. - Each concentric circle underneath the number (2) is called a
layerand the data shown for items and layers as a whole is called aview. A layer can be a genome, a metagenome, or anything else depending on which mode the anvi’o interactive was initiated. The view is like a data table where a datum is set for each item in each layer. The view data is typically computed by anvi’o and stored in pan databases by anvi-pan-genome or profile databases by anvi-profile. The user add another view to the relevant combo box in the interface by providing a TAB-delimited file to anvi-interactive through the command line argument--additional-view, or add new layers to extend these vies with additional data through misc-data-items. - The tree denoted by (3) shows a specific ordering of layers. Anvi’o will compute various layer orders automatically based on available view depending on the analysis or visualization mode, and users can extend available layer orders through misc-data-layer-orders.
- What is shown by (4) is the additional data for layers. the user can extend this section with additional information on layers using the misc-data-layers.
The orchestrated use of anvi-import-misc-data, anvi-export-misc-data, and anvi-delete-misc-data provides a powerful framework to decorate items or layers in a display and enhance visualization of complex data. Please take a look at the following article on how to extend anvi’o displays:
Programs that give interactive access
If you’re new to the anvi’o interactive interface, you’ll probably want to check out this tutorial for beginners or the other resources on the anvi-interactive page.
However, there are more interfaces available in anvi’o than just that one, so let’s list them out:
-
anvi-display-structure lets you examine specific protein structures, along with SCV and SAAVs within it. (It even has its own software page.. It’s kind of a big deal.)
-
anvi-display-contigs-stats shows you various stats about the contigs within a contigs-db, such as their hmm-hits, lengths, N and L statistics, and so on.
-
anvi-display-metabolism is still under development but will allow you to interactively view metabolism estimation data using anvi-estimate-metabolism under the hood.
-
anvi-display-pan displays information about the gene clusters that are stored in a pan-db. It lets you easily view your core and accessory genes, and can even be turned into a metapangenome through importing additional data tables.
-
anvi-inspect lets you look at a single split across your samples, as well as the genes identified within it. This interface can also be opened from the anvi-interactive interface by asking for details about a specific split.
-
anvi-interactive displays the information in a profile-db. It lets you view the distribution of your contigs across your samples, manually bin metagenomic data into MAGSs (and refine those bins with anvi-refine), and much more. You can also use this to look at your genes instead of your contigs or examine the genomes after a phylogenomic anlysis. Just look at that program page for a glimpse of this program’s amazingness.
-
anvi-script-snvs-to-interactive lets you view a comprehensive summary of the SNVs, SCVs, and SAAVs within your contigs.
Edit this file to update this information.