interactive [artifact]
Table of Contents
- Provided by
- Required or used by
- Description
- Terminology
- Programs that give interactive access
- Artifacts that give interactive access
- An overview of the display
- Settings panel
- Main Tab
- Layers tab
- Samples tab
- Bins tab
- Legends tab
- Search tab
- Mouse panel
- News panel
- Description panel
- Interactive interface tips + tricks
- Keyboard shortcuts
![]()
A DISPLAY-type anvi’o artifact. This artifact is typically generated, used, and/or exported by anvi’o (and not provided by the user)..
🔙 To the main page of anvi’o programs and artifacts.
Provided by
anvi-display-contigs-stats anvi-display-functions anvi-display-metabolism anvi-display-pan anvi-display-structure anvi-inspect anvi-interactive anvi-script-checkm-tree-to-interactive anvi-script-gen-functions-per-group-stats-output anvi-script-snvs-to-interactive
Required or used by
There are no anvi’o tools that use or require this artifact directly, which means it is most likely an end-product for the user.
Description
This page describes general properties of anvi’o interactive displays and programs that offer anvi’o interactive artifacts.
Terminology
Anvi’o uses a simple terminology to address various aspects of interactive displays it produces, such as items, layers, views, orders, and so on. The purpose of this section is to provide some insights into these terminology using the figure below:
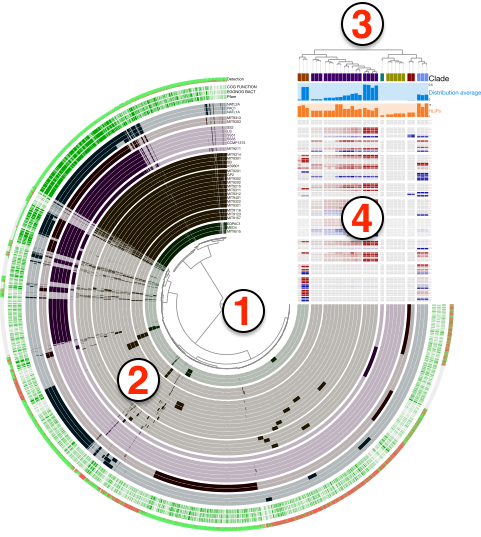
Even though the figure is a product of anvi-display-pan, the general terminology does not change across different interfaces, including the default visualizations of anvi-interactive. Here are the descriptions of numbered areas in the figure:
- The tree denoted by (1) shows the organization of each
item. Items could be contigs, gene clusters, bins, genes, or anything else depending on which mode the anvi’o interactive interface was initiated. The structure that orders items and denoted by (1) in the figure can be a phylogenetic or phylogenomic tree, or a dendrogram produced by a hierarchical clustering algorithm. In addition, there may be nothing there, if the user has requested or set a linear items order through misc-data-items-order. - Each concentric circle underneath the number (2) is called a
layerand the data shown for items and layers as a whole is called aview. A layer can be a genome, a metagenome, or anything else depending on which mode the anvi’o interactive was initiated. The view is like a data table where a datum is set for each item in each layer. The view data is typically computed by anvi’o and stored in pan databases by anvi-pan-genome or profile databases by anvi-profile. The user add another view to the relevant combo box in the interface by providing a TAB-delimited file to anvi-interactive through the command line argument--additional-view, or add new layers to extend these vies with additional data through misc-data-items. - The tree denoted by (3) shows a specific ordering of layers. Anvi’o will compute various layer orders automatically based on available view depending on the analysis or visualization mode, and users can extend available layer orders through misc-data-layer-orders.
- What is shown by (4) is the additional data for layers. the user can extend this section with additional information on layers using the misc-data-layers.
The orchestrated use of anvi-import-misc-data, anvi-export-misc-data, and anvi-delete-misc-data provides a powerful framework to decorate items or layers in a display and enhance visualization of complex data. Please take a look at the following article on how to extend anvi’o displays:
Programs that give interactive access
If you’re new to the anvi’o interactive interface, you’ll probably want to check out this tutorial for beginners or the other resources on the anvi-interactive page.
However, there are more interfaces available in anvi’o than just that one, so let’s list them out:
-
anvi-display-structure lets you examine specific protein structures, along with SCV and SAAVs within it. (It even has its own software page.. It’s kind of a big deal.)
-
anvi-display-contigs-stats shows you various stats about the contigs within a contigs-db, such as their hmm-hits, lengths, N and L statistics, and so on.
-
anvi-display-functions lets you quickly browse the functional pool for a given set of genomes or metagenomes.
-
anvi-display-metabolism is still under development but will allow you to interactively view metabolism estimation data using anvi-estimate-metabolism under the hood.
-
anvi-display-pan displays information about the gene clusters that are stored in a pan-db. It lets you easily view your core and accessory genes, and can even be turned into a metapangenome through importing additional data tables.
-
anvi-inspect lets you look at a single split across your samples, as well as the genes identified within it. This interface can also be opened from the anvi-interactive interface by asking for details about a specific split.
-
anvi-interactive displays the information in a profile-db. It lets you view the distribution of your contigs across your samples, manually bin metagenomic data into MAGSs (and refine those bins with anvi-refine), and much more. You can also use this to look at your genes instead of your contigs or examine the genomes after a phylogenomic analysis. Just look at that program page for a glimpse of this program’s amazingness.
-
anvi-script-snvs-to-interactive lets you view a comprehensive summary of the SNVs, SCVs, and SAAVs within your contigs.
Artifacts that give interactive access
-
gene-cluster-inspection lets you examine specific gene clusters.
-
contig-inspection shows you detailed contig information.
An overview of the display
The interactive interface has three major areas of interaction:
- The space for visualization in the middle area,
- The Settings panel on the left of the screen,
- And three additional panels for ‘News’, ‘Description’, and ‘Mouse’ on the right.
Each panel is important, but the most important and functionally rich one is the ‘Settings’ panel.
Settings panel
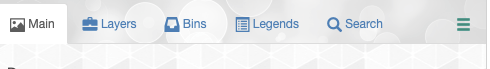
If closed, the settings panel can be opened by clicking on the little button on the left-middle part of your browser. When opened, you will see multiple tabs:
But before we start talking about these tabs, it is worthwhile to mention that at the bottom of the settings panel you will find a section with tiny controls that are available in all tabs:
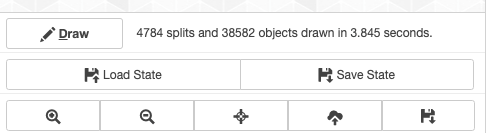
Through these controls you can,
-
Create or refresh the display when necessary using the draw button (some changes require you to do that),
-
Zoom in, zoom out, and center the display.
-
Download your display as an SVG file.
Finally, at the top-right of the Settings panel header you will find a dropdown menu (hamburger menu) which provides links to external information, resources, and issue-reporting related to anvi’o.
OK. Let’s talk about each tab you will find in the settings panel.
Main Tab
This is one of the most frequently used tabs in the interface, and there are multiple sections in it (keeps growing over time, so things may be missing here).
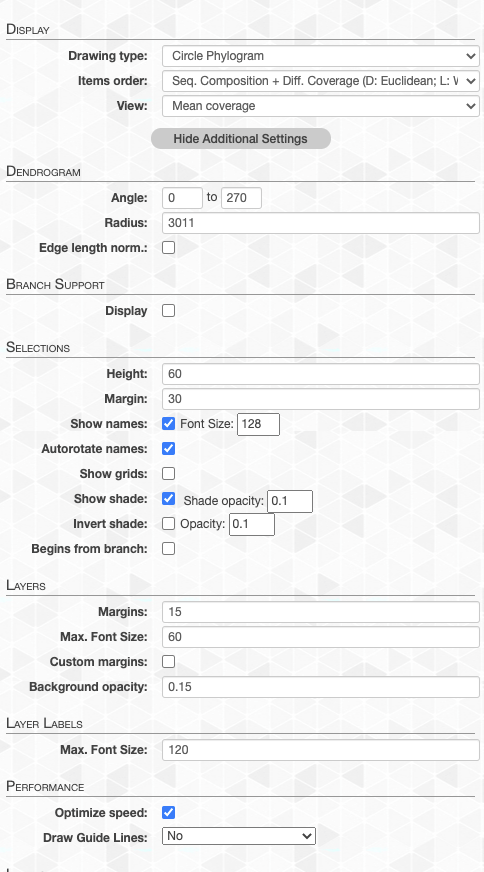
- Display subsection. Provides high level options for adjusting items order, view, and drawing type.
Clicking the Show Additional Settings button provides access to myriad additional, more-granular adjustments, including,
- Dendrogram subsection. Radius and Angle , and Edge length normalization adjustments for the dendrogram.
- Branch support subsection. Settings for displaying bootstrap values on the dendrogram.
- Selections subsection. To adjust height, grid and/or shade display, as well as selection name settings.
- Layers subsection. Display and label settings.
- Performance subsection. Whether the SVG output is optimized for performance or granularity (very advanced stuff).
- Layers subsection. This is arguably the most important subsection in the Main tab that enables you to make very precise adjustments to how things should look like on your screen. You can adjust individual layer attributes like color, display type, height and min/max values. Click + drag each layer to rearrange how layers are ordered. Or edit attributes for multiple layers as well.
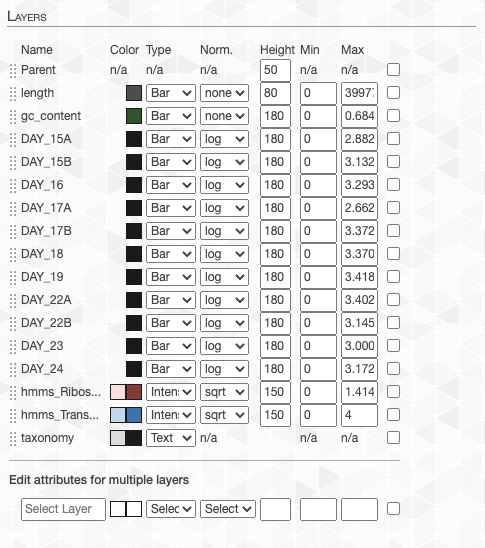
Mastering these in the Main Tab will minimize the post-processing of your anvi’o figures for high-quality and good-looking publication ready images.
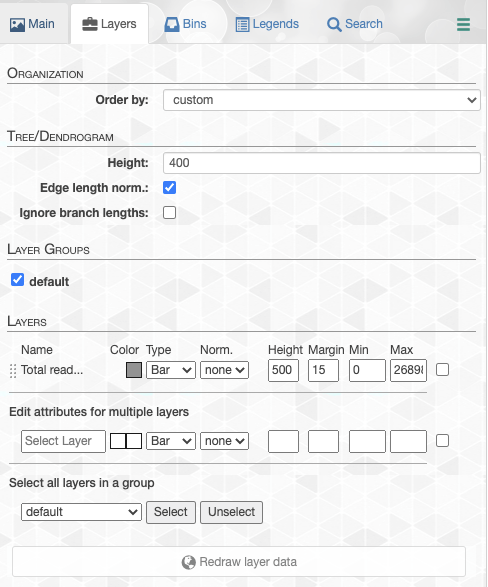
Layers tab
Through the layers tab you can,
-
Change general settings for the tree (i.e., switching between circle or rectengular displays, changing tree radius or width), and layers (i.e., editing layer margins, or activating custom layer margins).
-
Load or save states to store all visual settings, or load a previously saved state.
-
Customize individual layers by switching between different display modes depending on the layer type (i.e., ‘text’ or ‘color’ mode for categorical layers, or ‘bar’ or ‘intensity’ mode for numerical layers), set normalization (i.e., ‘square-root’, or ‘log’ normalization), minimum, and maximum cutoff values for numerical layers, or set layer height, and layer margin (i.e., its distance from the previous layer).
-
Use the multi-selector at the bottom to change settings for multiple layers at once.
Samples tab
Samples tab is for the additional data you provide the interface through a samples database (see samples order and samples information sections above). Through this layer you can,
-
Change the order of layers using automatically-generated or user-provided orders of layers using the Sample order combo box,
-
Customize individual samples information entries. Changes in this tab can be reflected to the current display without re-drawing the entire tree unless the sample order is changed.
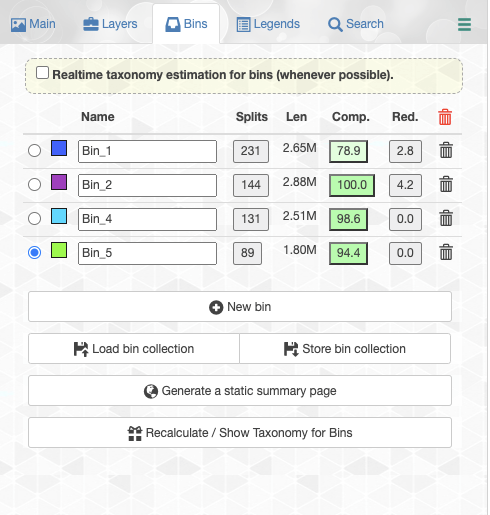
Bins tab
Anvi’o allows you to create selections of items shown in the display (whether they are contigs, gene clusters, or any other type of data shown in the display). Bins tab allow you to maintain these selections. Any selection on the tree will be added to active bin in this tab (the state radio button next to a bin defines its activity). Through this tab you can,
-
Create or delete bins, set bin names, change the color of a given bin, or sort bins based on their name, the number of units they carry, or completion and contamination estimates (completion / contamination estimates are only computed for genomic or metagenomic analyses).
-
View the number of selected units in a given bin, and see the list of names in the selection by clicking the button that shows the number of units described in the bin.
-
Store a collection of bins, or load a previously stored collection.
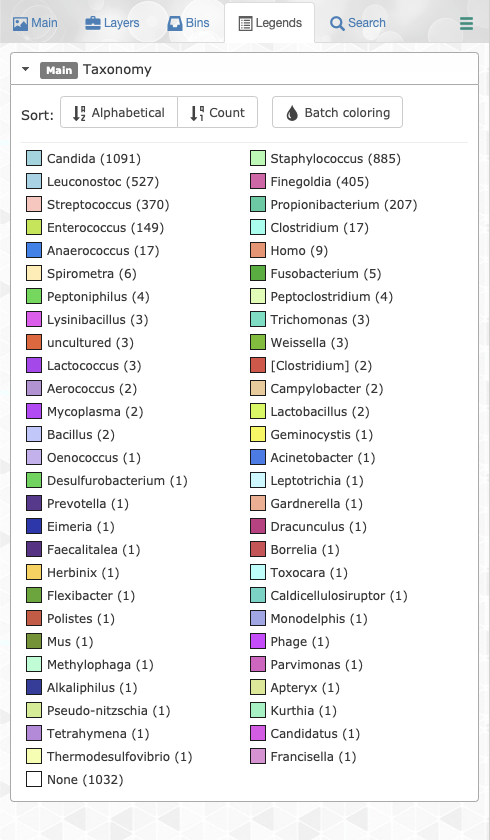
Legends tab
The legends tab enables users to easily change individual or batch legend colors for any of their additional data items
Search tab
It does what the name suggests. Using this tab you can,
-
Build expressions to search items visualized in the main display.
-
Highlight matches, and append them to, or remove them from the selected bin in the Bins tab.
Mouse panel
The mouse panel displays the value of items underneath the mouse pointer while the user browse the tree.
Displaying the numerical or categorical value of an item shown on the tree is not an easy task. We originally thought that displaying pop-up windows would solve it, but besides the great overhead, it often became a nuisance while browsing parts of the tree. We could show those pop-up displays only when use clicks on the tree, however click-behavior is much more appropriate to add or remove individual items from a bin, hence, it wasn’t the best solution either. So we came up with the ‘mouse panel’. You have a better idea? I am not surprised! We would love to try improve your experience: please enter an issue, and let’s discuss.
News panel
The news panel provides information and external links tracking major Anvi’o releases and development updates.
Description panel
- The description panel is a flexible, multipurpose space where users can,
- Store notes, comments, and any other stray items related to their project, in a feature-rich markdown environment.
- Display context, references, reproducibility instructions, and any other salient details for published figures.
Interactive interface tips + tricks
Here are some small conveniences that may help the interface serve you better (we are happy to expand these little tricks with your suggestions).
-
You can zoom to a section of the display by making a rectangular selection of the area while the pressing the shift button.
-
You can click an entire branch to add items into the selected bin, and remove them by right-clicking a branch.
-
If you click a branch while pressing the
CommandorCTRLbutton, it will create a new bin, and add the content of the selection into that bin. -
Tired of selecting items for binning one by one? right-click on an item and select Mark item as ‘range start’ to set an ‘in point’, then right-click on another item and select Add items in range to active bin or Remove items in range from any bin to manipulate many items with few clicks. Nice!
-
By pressing
1,2,3,4, and5, you can go between Layers, Bins, Samples, Mouse, and Search tabs!
Keyboard shortcuts
The interactive interface recognizes a handful of keyboard shortcuts to help speed up your workflow
- The
Skey toggles the Settings panel - The
Mkey toggles the Mouse panel - The
Nkey toggles the Description panel - The
Wkey toggles the News panel - The
Dkey triggers a redraw of your visualization - The
Tkey toggles showing the Title panel - Keys
1through5will toggle between tabs within the Settings panel, granted the Settings panel is currently shown. CTRL+ZandCTRL+SHIFT+Zwill undo or redo bin actions, respectively.
Edit this file to update this information.