anvi-interactive
Table of Contents
- Authors
- Requires
- Can use
- Provides
- Can provide
- Usage
- Running anvi-interactive on a profile database
- How to visualize things when you don’t have a hierarchical clustering of your contigs?
- Collection mode: Visualizing bins instead of contigs
- Genes mode: Visualizing genes instead of contigs
- Manual mode: visualize anything
- Extending anvi’o displays
- Visualization Settings
- Password protection
- Quick solutions for network problems
- Other things
- Command line interface
- Additional Resources
Start an anvi'o server for the interactive interface.
🔙 To the main page of anvi’o programs and artifacts.
Authors


Requires
Can use
single-profile-db  contigs-db genes-db bin
 view-data
 dendrogram
 phylogeny
Provides
Can provide
svg  collection
 bin contig-inspection
 dendrogram phylogeny
Usage
Initiates an interactive environment in your default browser.
Although it is generally associated with the typical concentric circles of ‘oimcs data, the anvi’o interactive interface has many forms and offers Anvi’oers a vast amount of functionality, from manual reconstruction of genomes from metagenomes to refinement of metagenome-assembled genomes, displaying nucleotide-level coverage patterns, single-nucleotide variants, pangenomes, phylogenomic trees, and more. While the circular display is the default method for data presentation, you can also display your data in a rectangular from (as seen here).
In fact, the interface has many of its own blog posts, including a pretty comprehensive introductory tutorial here and a breakdown of its data types here.
Here, we’ll go through some things that the anvi’o interactive interface is capable of through this program. More information about most of this can be found by calling anvi-interactive -h or by checking out the additional resources at the bottom of this page.
Please makes sure you are familiar with the terminology that describes various parts of a given display, which are explained in the interactive artifact:
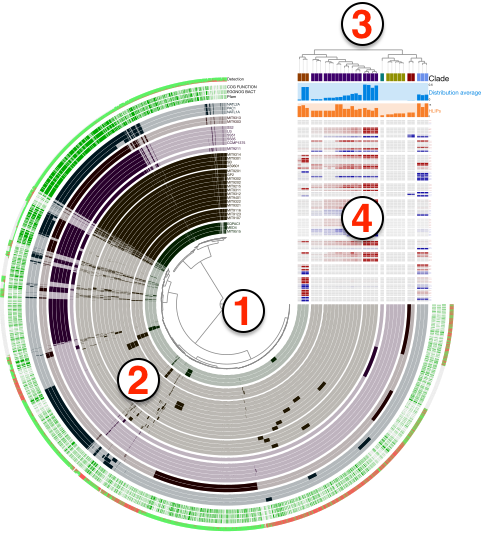
Running anvi-interactive on a profile database
One of the simplest ways to run the interactive interface (especially useful for manual binning) is just providing an anvi’o profile database and an anvi’o contigs database:
anvi-interactive -p profile-db \ -c contigs-db
For the central tree to display correctly, you’ll need to have run hierarchical clustering at some point while making your profile database (either during anvi-merge, or, if this is a single-profile-db, while running anvi-profile). It is also possible to provide a phylogenetic tree or a clustering dendrogram from the command line using the --tree parameter.
If you do not have a state stored in your profile database named default, you will need to click the “Draw” button for anvi’o to provide you with an interactive display of your data.
How to visualize things when you don’t have a hierarchical clustering of your contigs?
Typically the interactive displays that will be initiated with anvi-interactive will require an items order to display all your contigs. There are multiple ways for anvi’o to generate dendrograms.
Some advanced information you should feel free to skip: anvi’o uses a set of clustering-configuration files to decide which sources of data to use to cluster items. These recipes are essentially a set of configuration files for anvi’o to learn which information to use from contigs-db, profile-db, or pan-db type databases.
Some of the programs that generate dendrograms include anvi-merge, anvi-profile, and anvi-experimental-organization. But since hierarchical clustering is an extremely demanding process, anvi’o will skip this step during anvi-merge if there are more than 20,000 splits n the database. This is because the computational complexity of this process will get less and less feasible with increasing number of splits. You can force anvi’o to try to cluster your splits regardless of how many of them there are by using the flag --enforce-hierarchical-clustering. However, we strongly advice against it especially if you have more than 30,000 splits since your process will likely be killed by the operating system, or take a very very long time to finish (plus, if you have that many splits the performance of the interactive interface will be very low).
What happens if you don’t have a hierarchical clustering dendrogram, but you still wish to have an overall understanding of your data, or visualize the coverages of some contigs of interest or any contig at all? There are multiple ways you can do that:
- You can use anvi-inspect to visualize nucleotide- and gene-level coverages and single-nucleotide variants on individual contigs,
- You can use anvi-cluster-contigs to create a collection for your contigs and initiate
anvi-interactivein collection mode (see the subsection “visualizing bins instead of contigs” below. - You can import external binning results using anvi-import-collection, or manually identify contigs of interest, and use anvi-import-collection to create a collection of a smaller number of contigs. You can then use anvi-refine to visualize contigs in a single bin, or use anvi-split to first generate a split profile for your contigs to visualize your smaller dataset using anvi-interactive.
Collection mode: Visualizing bins instead of contigs
By default, when run on a profile database that resulted from a metagenomic workflow, anvi-interactive will initiate each contig as a separate item and organize them based on the clustering dendrograms provided (either automatically or by the user). But if there is a collection stored in the profile database, it is also possible to run anvi-interactive on a specific collection, during which anvi’o will use the underlying contig data to calculate summary statistics for each bin before displaying them. In collection mode, each item of your central plot will not represent a contig, but a bin within your collection. This is how the collection mode can be initialized in comparison to the default mode:
anvi-interactive -p profile-db \ -c contigs-db \ -C collection
The clustering of bins in this case based on their distribution across samples will be done automatically on-the-fly. See the note on this mode in the metagenomic workflow for more information.
Genes mode: Visualizing genes instead of contigs
You can also start the interactive interface in “gene mode”, in which each item of the central tree is a gene instead of a split or contig (or
bin like in “collection mode”).
To initiate the visualization in gene mode you need the following:
anvi-interactive -p profile-db \ -c contigs-db \ -C collection \ -b bin \ --gene-mode
If there isn’t one already, this command will automatically generate an anvi’o genes-db under the GENES directory at the same level of the profile database. When the same command is run again, anvi-interactive will use the existing genes database.
In this view you can order genes based on their distributions patterns across metagenomes (without paying attention to their synteny) or by ordering them based on their synteny in a given genome (without paying attention to their differential distribution). Figure 2 in this paper examples the latter, and Figure 5 in this paper examples the former case, which is also shown below:
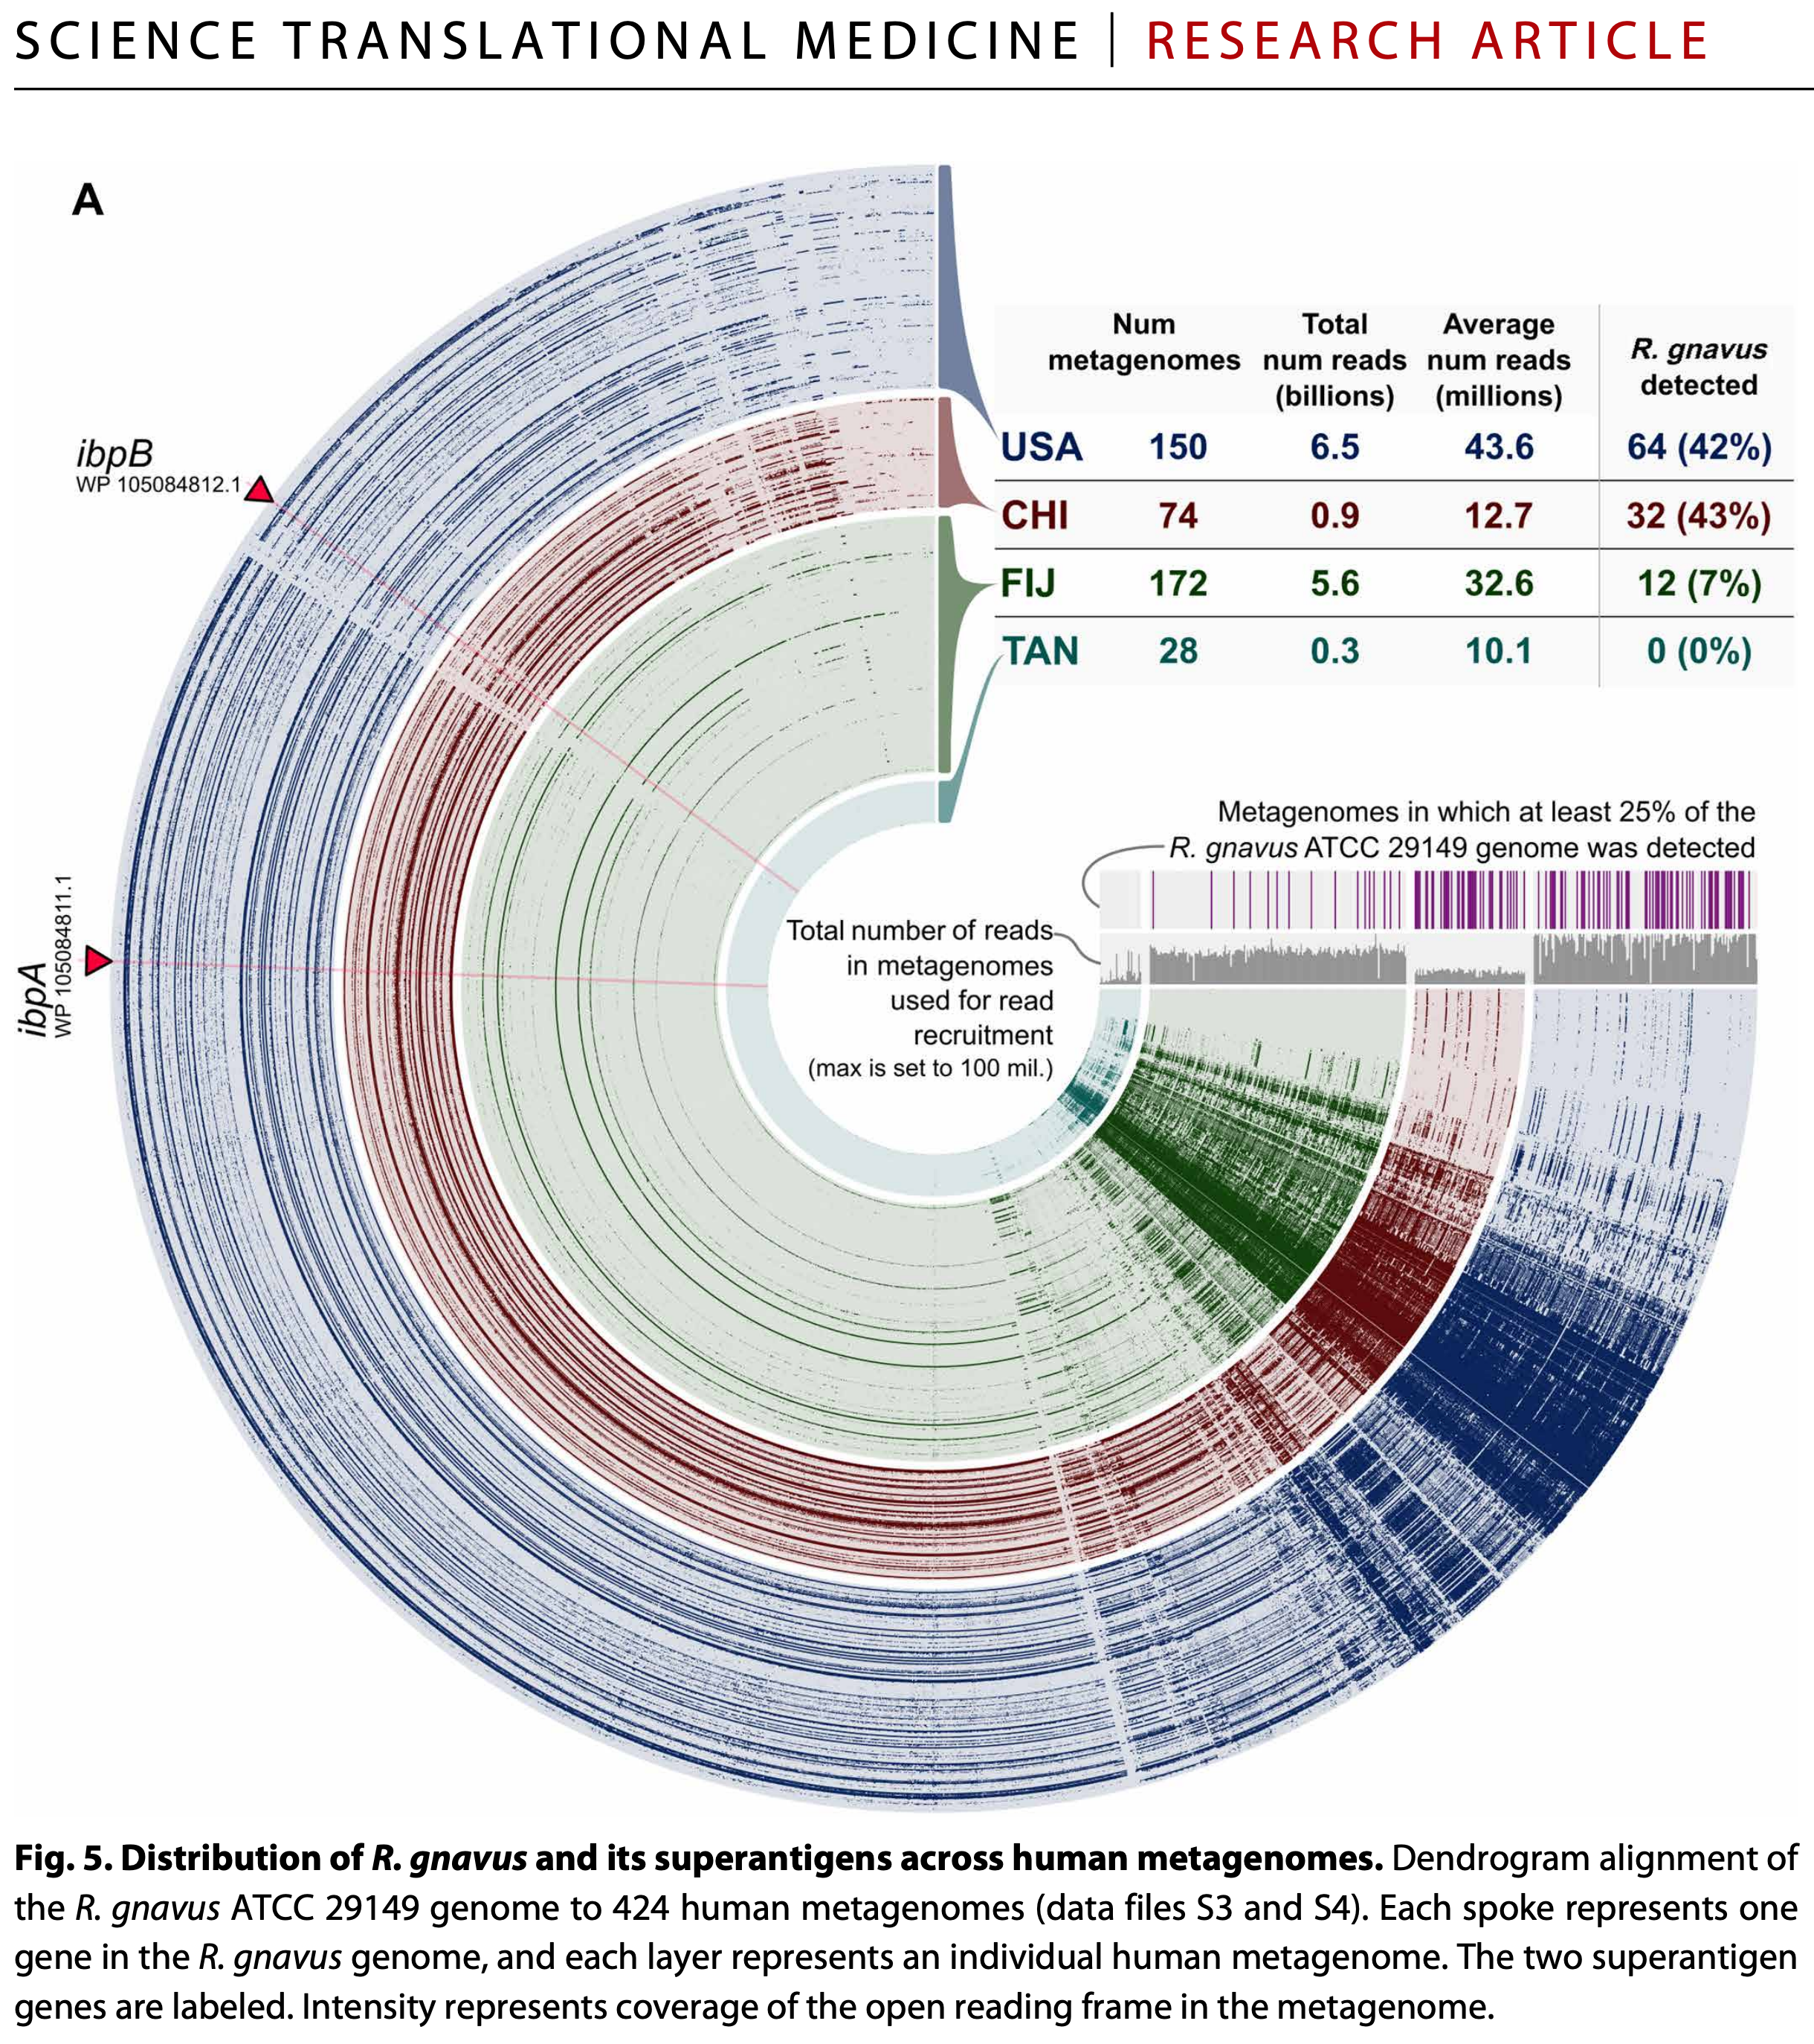
You can also visit this page to see another practical example from the Infant Gut tutorial.
Manual mode: visualize anything
You can also run the anvi’o interactive interface on ad hoc data that has nothing to do with anvi’o databases (here is a tutorial on this). To do that, you simply provide any of the following types of files individually or together, without a contigs-db:
- a TAB-delimited tabular data (
--view-data), - a NEWICK formatted tree (
--tree),
For instance:
anvi-interactive -d view_data.txt \ -t tree.txt \ -p my-display-PROFILE.db
When doing this kind of run, anvi’o does not expect you to have a profile database, but it still needs you to provide a name for it. Anvi’o will simply create an empty one for you so you can store your state or collections in it for reproducibility. When you run the same command again, anvi’o will find the same profile database and will remember everything you have stored in it.
Anvi’o recognizes this kind of run automatically, and starts the interface in what we call the ‘manual mode’. In older versions of anvi’o you had to use the flag --manual-mode (or --manual) to ask for it explicitly. This is no longer necessary, but anvi’o will continue to accept these flags so your older commands will work.
There is one case where you will need the --manual-mode flag: if you provide a tree or a data file without -p or -c in a directory where anvi’o can find a profile-db and a contigs-db, anvi’o can’t tell whether you want to see your files alone, or on top of those databases. In that case it will ask you to be precise, either by using --manual-mode with a profile database path of your choice, or by providing the databases you want to use explicitly with -p and -c.
If the items in your display have sequences (for instance, a tree you have computed from a multiple sequence alignment), you can also provide a FASTA file with --fasta-file, in which case the names of the sequences must match the names of the items in your display:
anvi-interactive -t dendrogram \ --fasta-file fasta \ -p profile-db
Curating bins in manual mode
In manual mode, clicking on the number of items of a bin in the Bins panel opens a curation window for that bin. This window lists every item in the bin with a checkbox, and offers buttons to select all items, none of them, or invert the current selection. Once you have selected some items, you can remove them from the bin, or move them to another bin. The window that opens when you choose to move items lists the existing bins, and also offers to move them to a new bin with a name anvi’o suggests (which you can change). New bins are created only when you apply your changes. These operations are only staged: the affected items are struck through and tagged in the window, and nothing happens to your bins until you click ‘Apply’. Clicking ‘Discard all changes’ throws away all staged changes and lets you start over in the same window, and closing the window while there are staged changes discards them as well (after asking you to confirm). All changes applied at once can be reverted with a single ‘undo’.
The same window also shows a ‘Sequences’ section that lists the sequence of each item, so you can compare them and spot unexpected or odd ones that you may want to remove from the bin. Sequences are not wrapped, so if they come from an alignment their columns line up with each other. The checkboxes in this section are synchronized with those in the ‘Splits’ section, and you can copy the sequences of all remaining items, or only the checked ones, to your clipboard in FASTA format. If you do not wish to see the sequences, you can uncheck the box “Show sequences in the bin items window” in the Bins panel.
If your sequences are not already aligned, you can check the box “Align sequences before showing them” in the Bins panel (it is unchecked by default). When it is checked, anvi’o aligns the sequences in the bin with its default aligner (any gap characters in your FASTA file are removed first), so their columns line up and odd sequences are easier to spot. In this case the FASTA you copy to your clipboard will contain the aligned sequences. Please keep in mind that aligning many or very long sequences may take a while. Aligned sequences are colored the same way anvi-display-pan colors the amino acid sequences of gene clusters (which is designed for amino acids, so colors will not mean much for nucleotide sequences), unless there are so many residues that coloring them would make the interface sluggish.
Getting a new FASTA file after curating bins
In manual mode with a FASTA file, the Bins panel also offers to download a copy of the input FASTA either excluding the sequences in your bins, or only with the sequences in your bins. Clicking either of these buttons opens a window where you can select the bins to consider and change the name of the new file, which your browser will save like any other download. The new FASTA file reflects your bins as they are in the interface at that moment (whether you stored them in a collection or not), and its sequences appear in the same order and with the same deflines as in the input FASTA file. Entries in the input FASTA that do not appear in your display are kept when you exclude sequences in bins (since they can’t be in a bin).
If/when you provide a FASTA file to anvi-interactive, the combination of displaying sequences (with the option to align them on-the-fly) AND being able to move them around or mark them for deletion by adding unruly sequences to specific bins, becomes an extremely powerful way to manually curate your phylogenetic trees.
Extending anvi’o displays
You can extend any interactive display in anvi’o with additional data related to your project through the program anvi-import-misc-data. This article describes a detailed use of this program.
While the use of anvi-import-misc-data is the most effective way to improve anvi’o displays, you can also use the parameter --additional-layers to provide a TAB-delimited file (misc-data-items-txt) that contains additional layers of information over your items.
If you want to add an entirely new view to the interface, you can do that too, as long as you provide a file containing all split names and their associated values. For more information, see the parameter --additional-view.
You can also provide the manual inputs even if you’re using an anvi’o database. For example, if you provide your own NEWICK formatted tree, you will have the option to display it instead of the one in your database.
Visualization Settings
In anvi’o, the visualization settings at a given time are called a state.
To open the interface in a specific state, you can use the --state-autoload flag or by importing a state using anvi-import-state.
You can also customize various aspects of the interactive interface. For example, you can change the preselected view, title, and taxonomic level displayed (for example, showing the class name instead of the genus name). You can also hide outlier single nucleotide variations or open only a specific collection.
Password protection
Use --password-protected flag to limit access to your interactive instances, which by default will be accessible to anyone on your network.
Quick solutions for network problems
In a typical run, anvi-interactive initiates a local server to which you connect through your browser to visualize data. Which can yield unexpected problems if you are running anvi’o in virtual environments such as Windows Subsystem for Linux. If your browser does not show up, or you get cryptic errors such as “tcgetpgrp failed: Not a tty”, you can always simplify things by manually setting network properties such as --ip-address and --port-number.
For instance you can start an interactive interface the following way:
anvi-interactive -p profile-db \ -c contigs-db \ --ip-address 127.0.0.1 \ --port-number 8901 \ --server-only
Which would not initiate your browser, but then you can open your browser and go to this address to work with the anvi’o interactive interface:
Other things
Viewing your data
You can use this program to look at the available information in your databases, which is very convenient. For example, you can view all of the available
- views (using
--show-views) - states (using
--show-states) - collections (using
--list-collections)
Edit this file to update this information.
Command line interface
The following is the list of parameters and their descriptions in the latest version of anvi-interactive.
The code that generates this web page ensures that this information is the latest available in 9-dev (eunice). Which means, in some cases the information in this section (generated automatically) might be more comprehensive or up-to-date compared to the descriptions above (written by humans).
Command line usage
Parameters and their descriptions
-p, --profile-dbPROFILE_DB- Anvi'o profile database
-c, --contigs-dbCONTIGS_DB- Anvi'o contigs database generated by 'anvi-gen-contigs-database'
-C, --collection-nameCOLLECTION_NAME- If you have a collection in your profile database, you can use this flag to start the interactive interface with a tree showing your bins in your collection, instead of each split. This is very useful when you have imported your external binning results into anvi'o, and want to see the distribution of your bins across samples. In these cases anvi'o will cluster your bins and based on multiple metrics. Because this particular clustering will be done on the fly within anvi'o interactive class, you get to define a distance metric and a linkage method using --linkage and --distance parameters if you want!
--manual-mode, --manual- You will rarely need this flag, since anvi'o starts the interactive interface in manual mode automatically when it is given ad hoc input files (such as a tree or a view data file) without a contigs database. But if there are anvi'o databases in your work directory, anvi'o may not be sure whether you want to visualize your files alone or on top of those databases, and ask you to use this flag to be precise. In the manual mode the profile database is only used to store the 'state' of the interface and collections, and if it does not exist, anvi'o will create an empty one for you.
-f, --fasta-fileFASTA FILE- A FASTA-formatted input file.
-d, --view-dataVIEW_DATA- A TAB-delimited file for view data
-t, --treeNEWICK- NEWICK formatted tree structure
--items-orderFLAT_FILE- A flat file that contains the order of items you wish the display using the interactive interface. You may want to use this if you have a specific order of items in your mind, and do not want to display a tree in the middle (or simply you don't have one). The file format is simple: each line should have an item name, and there should be no header.
-V, --additional-viewADDITIONAL_VIEW- A TAB-delimited file for an additional view to be used in the interface. This file should contain all split names, and values for each of them in all samples. Each column in this file must correspond to a sample name. Content of this file will be called 'user_view', which will be available as a new item in the 'views' combo box in the interface
-A, --additional-layersADDITIONAL_LAYERS- A TAB-delimited file for additional layers for splits. The first column of this file must be split names, and the remaining columns should be unique attributes. The file does not need to contain all split names, or values for each split in every column. Anvi'o will try to deal with missing data nicely. Each column in this file will be visualized as a new layer in the tree.
-F, --annotation-source-for-per-split-summaryFUNCTION ANNOTATION SOURCE- Using this parameter with a functional annotation source that (1) is in the contigs database and (2) has a maximum of 10 different function names, will dynamically add a new layer to the intearctive interface where proportions of functions in that source will be shown per split as stacked bar charts.
--gene-mode- Initiate the interactive interface in 'gene mode'. In this mode, the items are genes (instead of splits of contigs). The following views are available: detection (the detection value of each gene in each sample). The mean_coverage (the mean coverage of genes). The non_outlier_mean_coverage (the mean coverage of the non-outlier nucleotide positions of each gene in each sample (median absolute deviation is used to remove outliers per gene per sample)). The non_outlier_coverage_std view (standard deviation of the coverage of non-outlier positions of genes in samples). You can also choose to order items and layers according to each one of the aforementioned views. In addition, all layer ordering that are available in the regular mode (i.e. the full mode where you have contigs/splits) are also available in 'gene mode', so that, for example, you can choose to order the layers according to 'detection', and that would be the order according to the detection values of splits, whereas if you choose 'genes_detections' then the order of layers would be according to the detection values of genes. Inspection and sequence functionality are available (through the right-click menu), except now sequences are of the specific gene. Inspection has now two options available: 'Inspect Context', which brings you to the inspection page of the split to which the gene belongs where the inspected gene will be highlighted in yellow in the bottom, and 'Inspect Gene', which opens the inspection page only for the gene and 100 nts around each side of it (the purpose of this option is to make the inspection page load faster if you only want to look at the nucleotide coverage of a specific gene). NOTICE: You can't store states or collections in 'gene mode'. However, you still can make fake selections, and create fake bins for your viewing convenience only (smiley). Search options are available, and you can even search for functions if you have them in your contigs database. ANOTHER NOTICE: loading this mode might take a while if your bin has many genes, and your profile database has many samples, this is because the gene coverages stats are computed in an ad-hoc manner when you load this mode, we know this is not ideal and we plan to improve that (along with other things). If you have suggestions/complaints regarding this mode please comment on this github issue: https://goo.gl/yHhRei. Please refer to the online tutorial for more information.
--inseq-stats- Provide if working with INSeq/Tn-Seq genomic data. With this, all gene level coverage stats will be calculated using INSeq/Tn-Seq statistical methods.
-b, --bin-idBIN_NAME- Bin name you are interested in.
--show-views- When declared, the program will show a list of available views, and exit.
--skip-check-names- For debugging purposes. You should never really need it.
-o, --output-dirDIR_PATH- Directory path for output files
--dry-run- Don't do anything real. Test everything, and stop right before wherever the developer said 'well, this is enough testing', and decided to print out results.
--show-states- When declared the program will print all available states and exit.
--list-collections- Show available collections and exit.
--skip-init-functions- When declared, function calls for genes will not be initialized (therefore will be missing from all relevant interfaces or output files). The use of this flag may reduce the memory fingerprint and processing time for large datasets.
--skip-auto-ordering- When declared, the attempt to include automatically generated orders of items based on additional data is skipped. In case those buggers cause issues with your data, and you still want to see your stuff and deal with the other issue maybe later.
--skip-news- Don't try to read news content from upstream.
--distanceDISTANCE_METRIC- The distance metric for the hierarchical clustering. Only relevant if you are running the interactive interface in "collection" mode. The default is "euclidean". Default:
euclidean --linkageLINKAGE_METHOD- The linkage method for the hierarchical clustering. Only relevant if you are running the interactive interface in "collection" mode. The default is "ward". Default:
ward
-I, --ip-addressIP_ADDR- IP address for the HTTP server. The default ip address (localhost) should work just fine for most. Default:
localhost -P, --port-numberINT- Port number to use for anvi'o services. If nothing is declared, anvi'o will try to find a suitable port number, starting from the default port number, 8080.
--browser-pathPATH- By default, anvi'o will use your default browser to launch the interactive interface. If you would like to use something else than your system default, you can provide a full path for an alternative browser using this parameter, and hope for the best. For instance we are using this parameter to call Google's experimental browser, Canary, which performs better with demanding visualizations.
--read-only- When the interactive interface is started with this flag, all 'database write' operations will be disabled.
--server-only- The default behavior is to start the local server, and fire up a browser that connects to the server. If you have other plans, and want to start the server without calling the browser, this is the flag you need.
--password-protected- If this flag is set, command line tool will ask you to enter a password and interactive interface will be only accessible after entering same password. This option is recommended for shared machines like clusters or shared networks where computers are not isolated.
--user-server-shutdown- Allow users to shutdown an anvi'server via web interface.
Additional Resources
Are you aware of resources that may help users better understand the utility of this program? Please feel free to edit this file on GitHub. If you are not sure how to do that, find the __resources__ tag in this file to see an example.