interactive
Table of Contents
![]()
A DISPLAY-type anvi’o artifact. This artifact is typically generated, used, and/or exported by anvi’o (and not provided by the user)..
🔙 To the main page of anvi’o programs and artifacts.
Provided by
anvi-display-contigs-stats anvi-display-codon-frequencies anvi-display-functions anvi-display-metabolism anvi-display-pan anvi-display-structure anvi-inspect anvi-interactive anvi-script-checkm-tree-to-interactive anvi-script-gen-functions-per-group-stats-output anvi-script-snvs-to-interactive
Required or used by
There are no anvi’o tools that use or require this artifact directly, which means it is most likely an end-product for the user.
Description
This page describes general properties of anvi’o interactive displays and programs that offer anvi’o interactive artifacts.
Terminology
Anvi’o uses a simple terminology to address various aspects of interactive displays it produces. The same terminology applies regardless of which program initiated the interface – whether it is anvi-interactive, anvi-display-pan, or any other display program. Here is a quick-reference table:
| Term | Definition |
|---|---|
| Items | The individual elements displayed in the central tree/dendrogram. Depending on the context, items can be contigs, gene clusters, genes, samples, or any other unit of data. Items are the rows of your data matrix. |
| Layers | The concentric rings of data that surround the central tree. Each layer represents a different data dimension – for instance, a sample’s coverage, a genome in a pangenome, or a categorical annotation. Layers are the columns of your data matrix. |
| View | A specific representation of your data. Different views show different aspects of the same dataset (e.g., mean coverage vs. detection in a metagenomic context). Views are stored in the database and can be extended with --additional-view. |
| Items order | The tree or dendrogram at the center of the display that organizes items. It can be a phylogenetic/phylogenomic tree, a hierarchical clustering dendrogram, or a linear order. Users can provide custom orders through misc-data-items-order. |
| Layer order | The tree or dendrogram that organizes layers around the display. Users can extend available layer orders through misc-data-layer-orders. |
| Bins | User-defined selections (groups) of items. You can create bins by clicking on branches of the tree. Bins are central to tasks like genome binning in metagenomics or selecting gene clusters in pangenomics. |
| Collection | A named set of bins that can be stored in the database and recalled later. |
| State | A saved configuration of all visual settings – layer order, colors, normalization, drawing type, etc. States are stored in the database and can be exported/imported with anvi-export-state and anvi-import-state. |
| Additional data | Extra information associated with items or layers that is not part of the core data matrix. Managed with anvi-import-misc-data, anvi-export-misc-data, and anvi-delete-misc-data. |
Now let’s see where each of these concepts lives in an actual display.
Items and layers
Items are the units arranged around the center of the display. What they represent depends entirely on the context: contigs in a metagenomic analysis, gene clusters in a pangenome, genomes in a phylogenomic tree, or anything else. Layers are the concentric rings of data surrounding the items tree. Each layer shows a data value for every item, like coverage of a contig in a given sample, or presence/absence of a gene cluster in a given genome.
Together, items and layers form a data matrix: items are the rows, layers are the columns.
Items order and layer order (dendrograms)
The items order is the tree or dendrogram at the center of the display. It determines how items are organized: it can be a phylogenetic tree, a hierarchical clustering dendrogram, or a simple linear order. The layer order is the smaller tree on the outside of the display that organizes layers. Anvi’o computes layer orders automatically, but you can provide your own through misc-data-layer-orders.
Views
A view defines what numerical values are displayed in the layers. For instance, in a metagenomics dataset, the data that can be viewed are mean coverage, detection, or variability; and with pangenome, the options are presence/absence or frequencies of gene clusters. Views are stored in the database and can be switched using the Data dropdown in the settings panel. You can also add custom views with the --additional-view flag.
Bins
Bins are user-defined groups of items. You create them by clicking on branches of the dendrogram. In a metagenomic context, bins typically represent metagenome-assembled genomes (MAGs). In a pangenomic context, they can represent groups of gene clusters (core genome, accessory genome, etc.). Bins are organized into collections that can be stored in the database and used by downstream programs like anvi-summarize.
Additional data for items and layers
Beyond the core view data, you can decorate your display with additional data for both items and layers. Additional data for items appears as extra layers on the outside of the display (e.g., taxonomy assignments, GC content, bin colors). Additional data for layers appears next to the layer order dendrogram (e.g., sample metadata like body site, or genome metadata like species name). These are managed through anvi-import-misc-data.
See this article for a detailed guide on extending anvi’o displays with additional data tables.
Settings panel
The interactive interface has two major areas of interaction: (1) the space for visualization in the middle area, described in the previous section and (2) the Settings panel on the left of the screen.

If closed, the settings panel can be opened by clicking on the little button on the left-middle part of your browser. When opened, you will see multiple tabs:
But before we start talking about these tabs, it is worthwhile to mention that at the bottom of the settings panel you will find a section with tiny controls that are available in all tabs:
Through these controls you can,
-
Draw: create or refresh the display.
-
Load or Save: to save the current state of the display or load another state. The state include all the aesthetic choices of your figure: from the heights and colors of your layers, to the choice of items/layer organisation. It does not include bins and collections! These have to be saved and loaded separately in the Bins tab.
-
Export: to download an SVG file of the current figure.
-
Align: center the display.
💡 Before talking about Tabs, here’s a useful tip: you can conveniently switch between tabs using your keypad. For instance, pressing 1 will navigate you to the Main tab, 2 to the Options tab, and so forth.
For more tips you can check out the Tips + Tricks section at the end of this page.
OK. Let’s talk about each tab you will find in the settings panel.
Main Tab
This is one of the most frequently used tabs in the interface, and there are multiple sections in it.
-
Items subsection
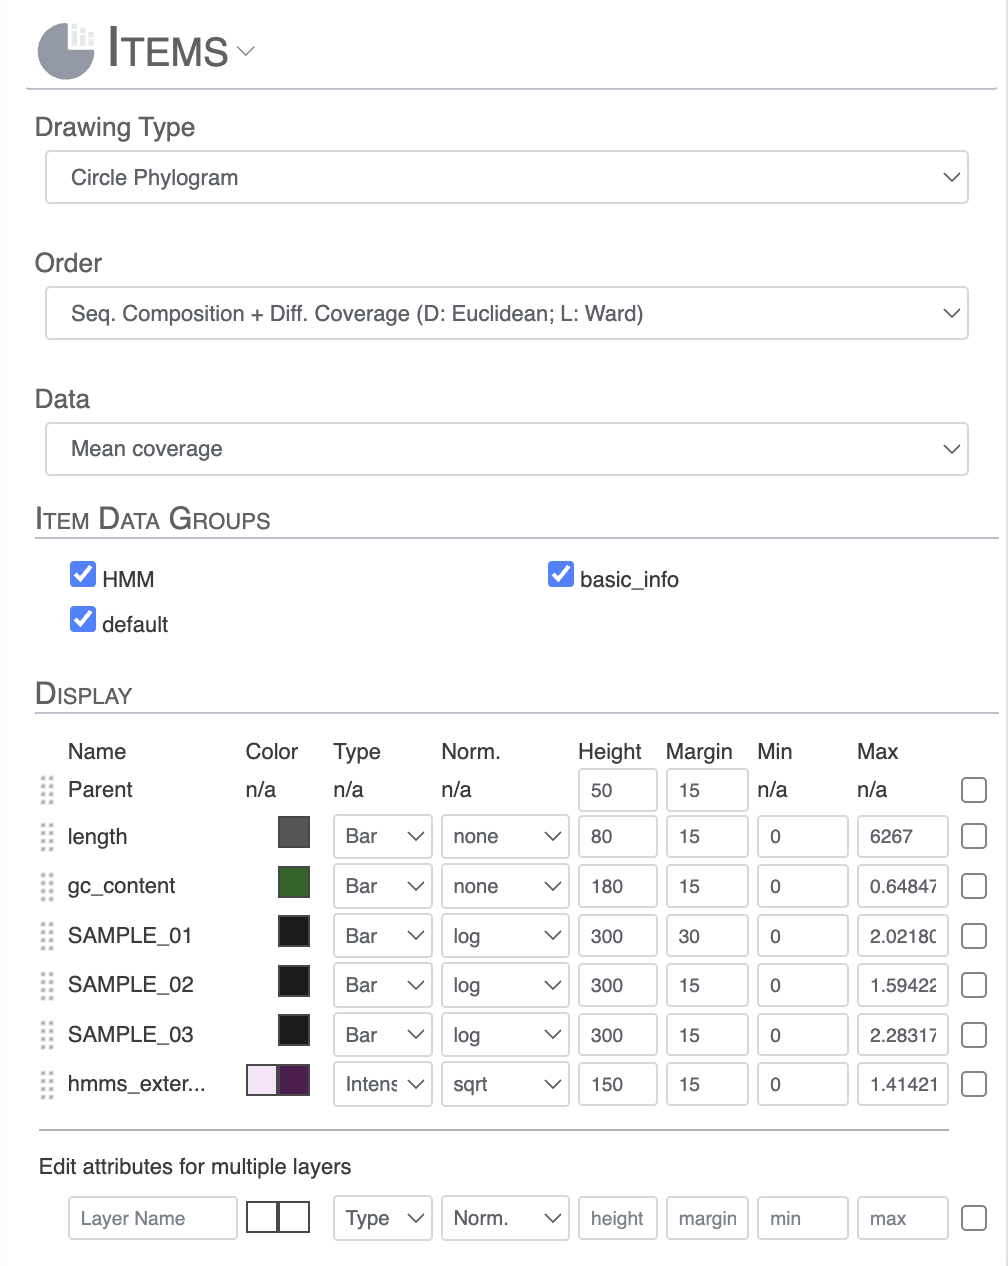
- Drawing type: change from Circle Phylogram to Phylogram (rectangular/square figure)
- Order: change how the items are ordered. Some orders are already computed according to the type of interface you are using, like “Seq. Composition + Diff. Coverage” or “Gene cluster presence absence”, or any user provided item order with anvi-import-items-order.
- Data: also called “Views”, it represents the data you wish you visualized in the main figure. In the context of read-recruitment, the options would include “mean coverage” or “detection” for instance.
- Item Data Group: some layers describing your items come as group which you can choose to toggle on/off to either keep them or remove them from the main figure.
- Display: this is where you can extensively modify the aesthetics of the layers displayed on your figure. You can drag and rearrange the order of these layers. You can also change their color, type (bar, intensity, line), normalization (none, log, square root), height, margin, min and max value.
- Edit attribute for multiple layers: if you select multiple layers using the check boxes, you can change values for multiple layers at once. Very useful if you want to change the color/height/whatever of a group of layers. The search box supports multiple search terms separated by semicolons (e.g.,
abundance;coverage;detectionwill select all layers matching any of those terms),*wildcards for pattern matching (e.g.,GC_*will matchGC_content,GC_skew, etc), or any combination of these (e.g.,hmms;DAY*18) for flexible layer selection.
If you want to remove a layer from the interface, simply change the height to a value of 0.
-
Layers subsection
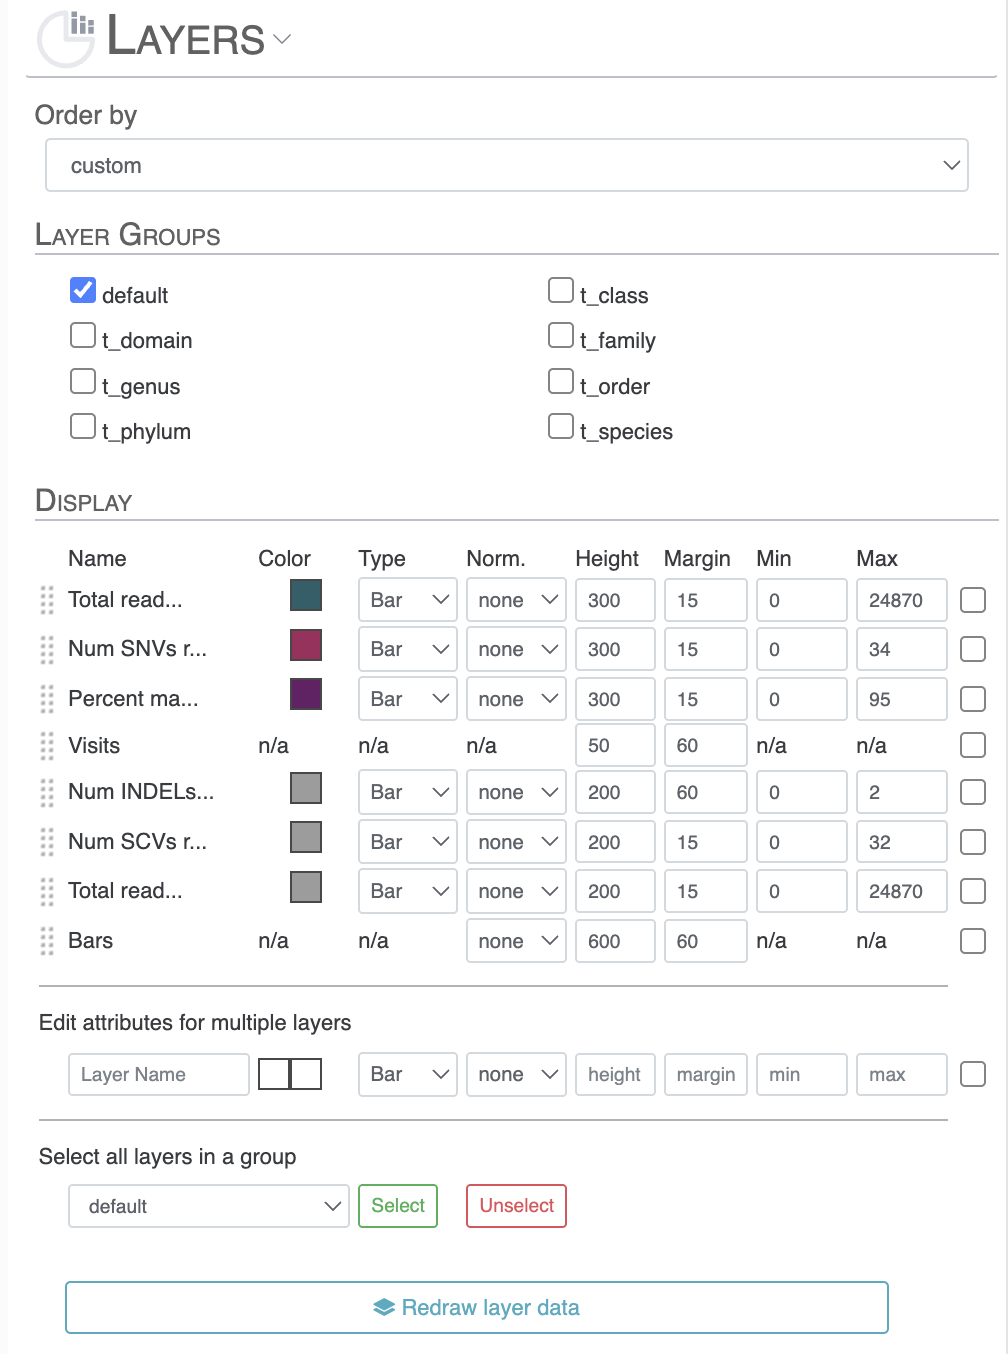
- Order by: similar to how you can reorder the items in the previous section, you can re-order the layers based on multiple features. The default order is alphabetical and it is often worth changing to something more meaningful.
- Layer Groups: just like for Item Data Group, some layer additional data come as group that you can choose to select/unselect to keep them or remove them from the interface.
- Display: once again, very similar to the equivalent section in the item subsection. You can manually reorganises the layer additional information, as well as modify the set of aesthetics features such as color, height, etc.
-
Edit attribute for multiple layers: if you select multiple layers using the check boxes, you can change values for multiple layers at once. The search box has the same features explained above.
-
Legends subsection
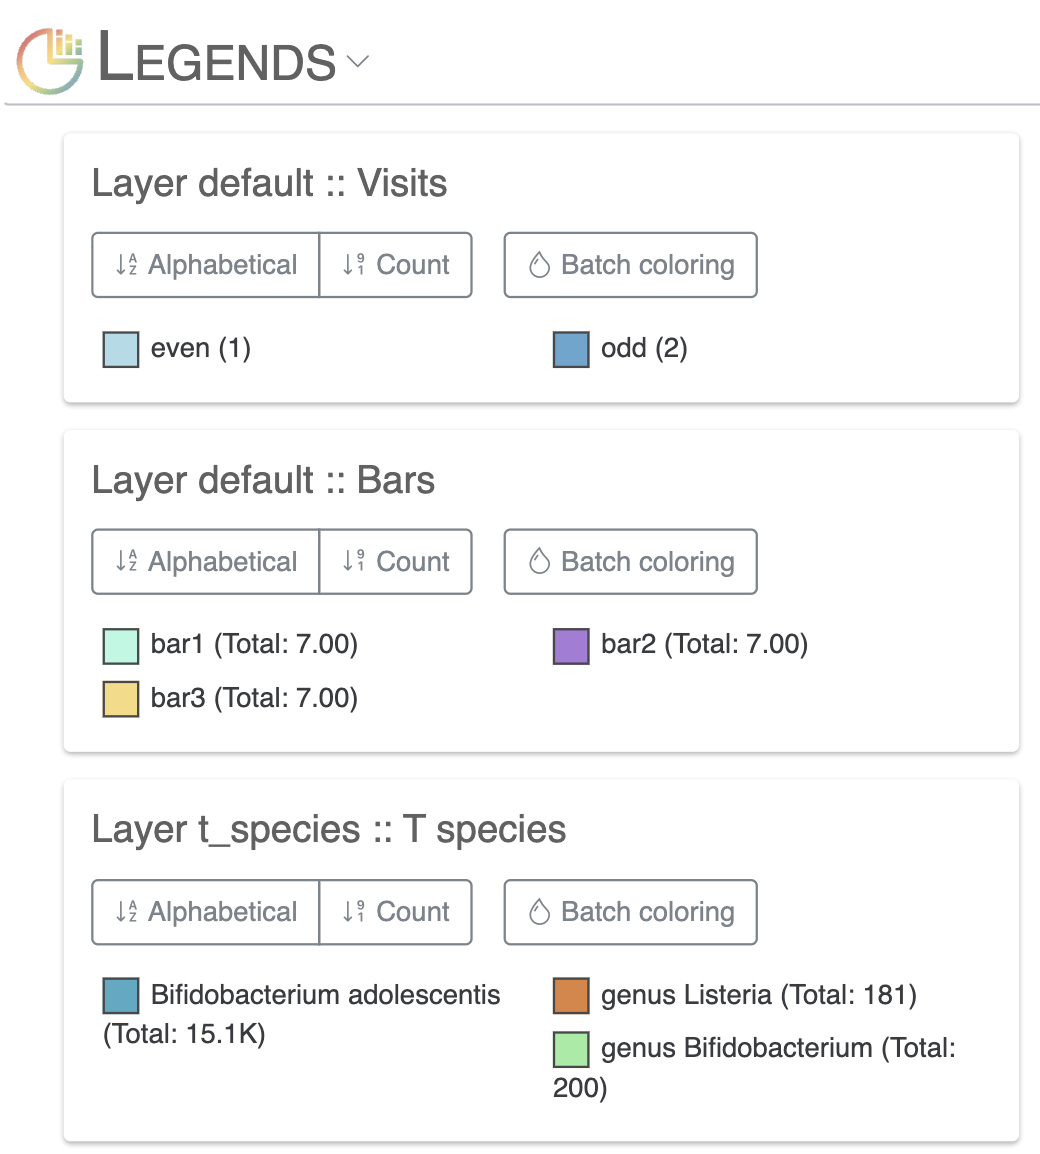
- This subsection enables users to easily change individual or batch legend colors for any of their additional data.
Options tab
In the Options tab, just like in the Main tab, we have two sections: Items and Layers.
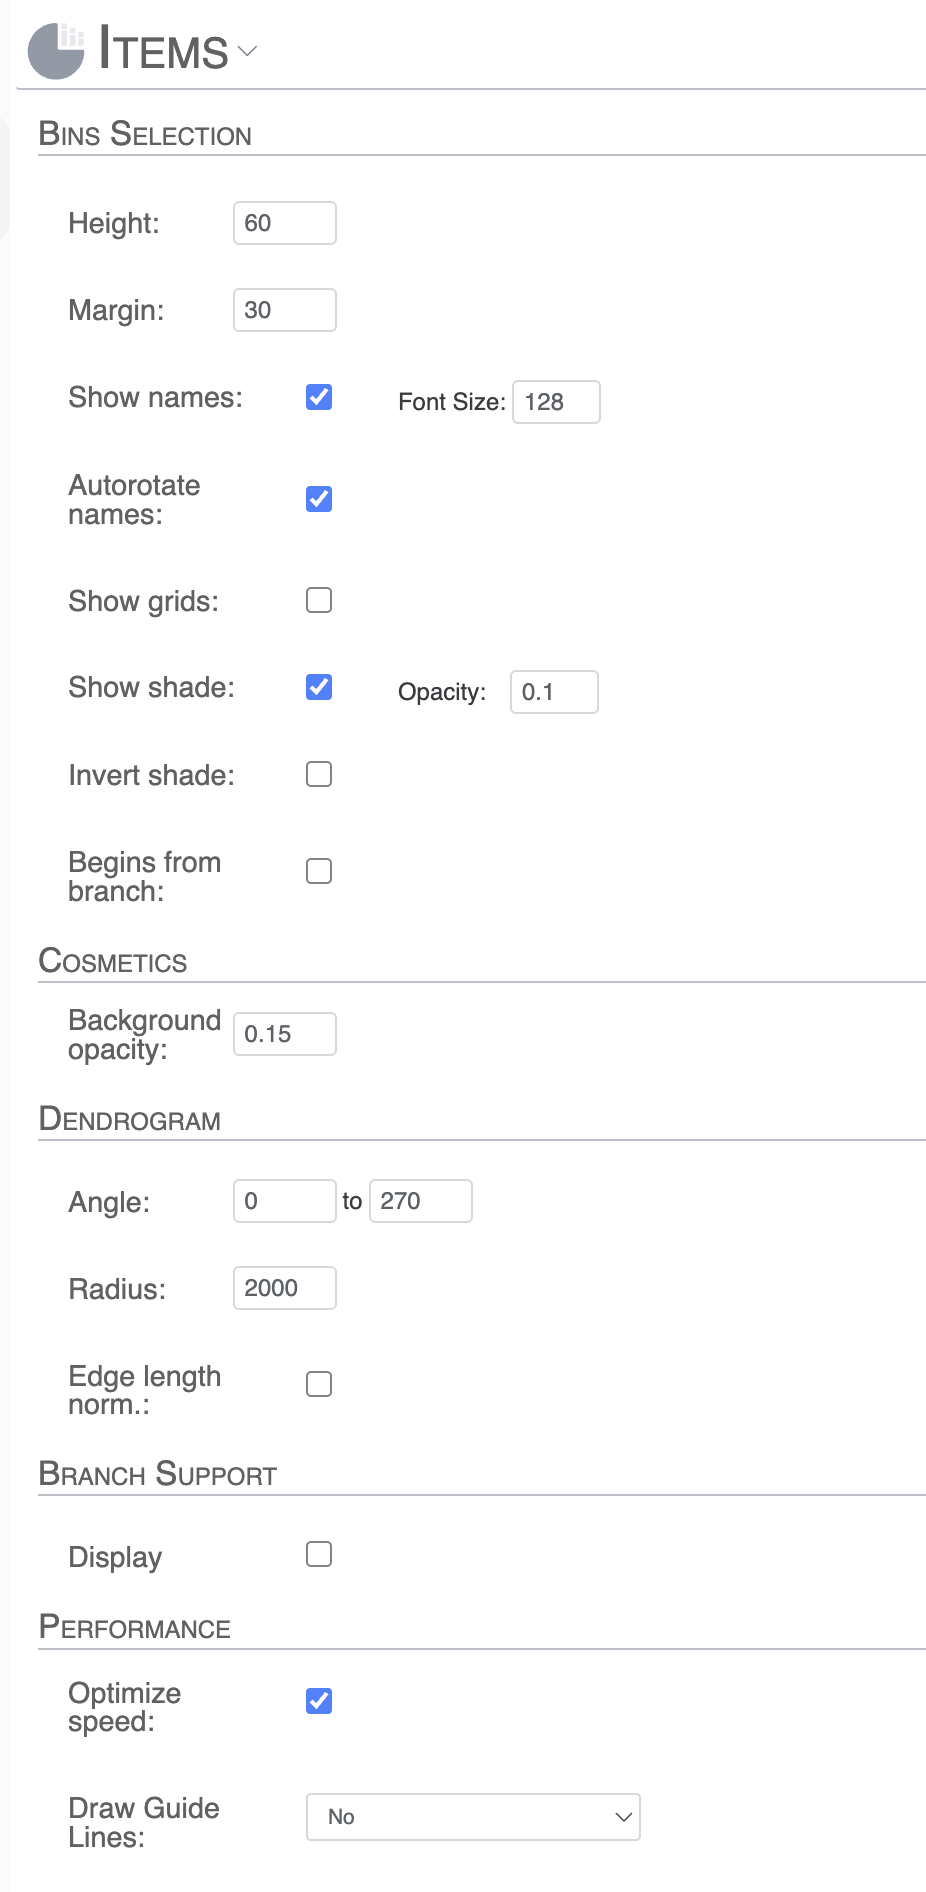
- Bins Selection: Allows us to customize the bins aesthetics like size, margin, text size, grids, opacity levels, and more
- Cosmetics: adjust the background opacity.
- Dendrogram: when using the circle phylogram, this is where you can change the Radius, Angle and Edge length normalization adjustments for the figure. When using the “Phylogram” type, this is where you can adjust the Height and Width of the figure.
- Branch support: Settings for displaying bootstrap values on the dendrogram when applicable. If you have branch support values, then this section expends and you can choose to display the bootstrap values as text or as colored dots (size proportional to value). You can also control the range of displayed values.
- Performance. Whether the SVG output is optimized for performance or granularity (very advanced stuff).
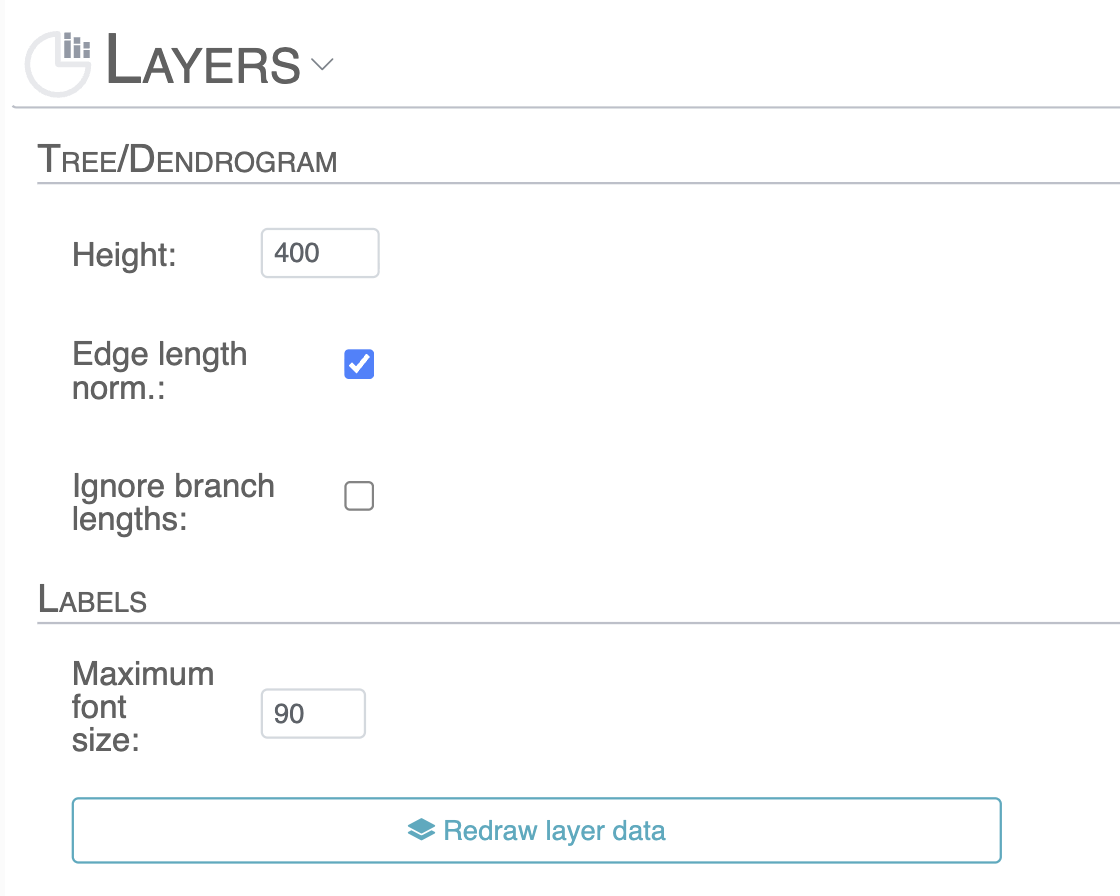
- Tree/Dendrogram: change the height and edge length normalization of the layer’s dendrogram.
- Label: settings for maximum font size on the Layer.
Mastering these in the Options Tab will minimize the post-processing of your anvi’o figures for high-quality and good-looking publication ready images.
Bins tab
Anvi’o allows you to create selections of items shown in the display (whether they are contigs, gene clusters, or any other type of data shown in the display). Bins tab allows you to maintain these selections. Any selection on the tree will be added to active bin in this tab, visible by the selection button on the left of the bin’s name.
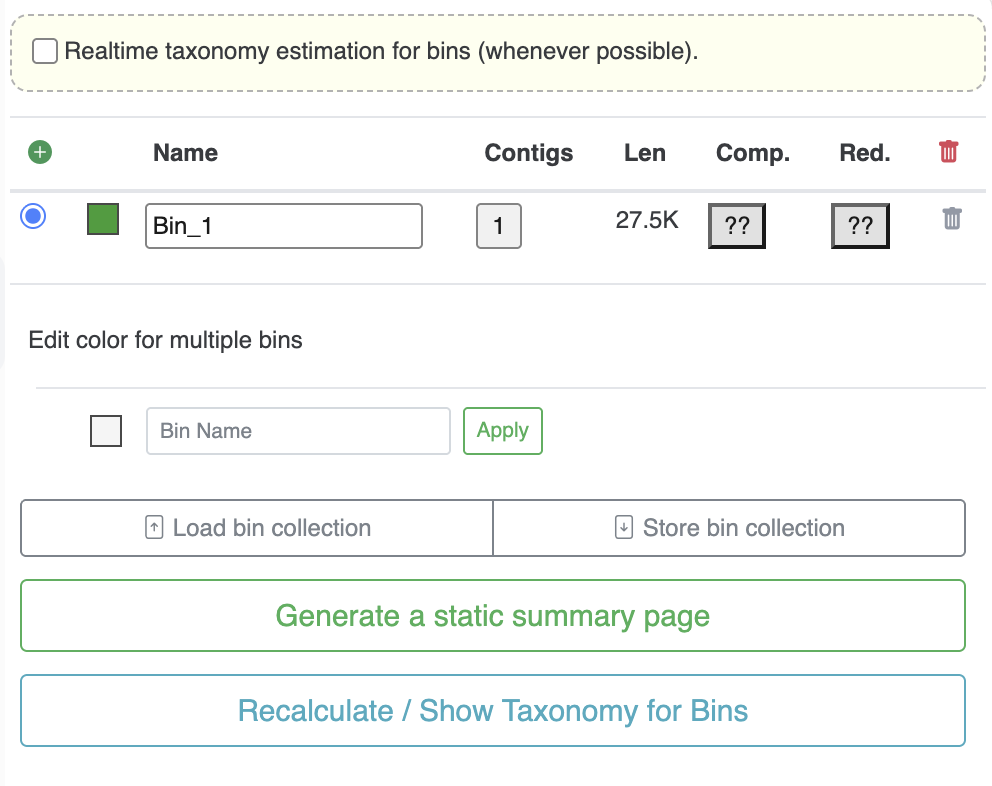
- Create a new bin: click on the green “plus” button. You can also hold “Ctrl” or “Cmd” when selecting items to create a new bin automatically.
- Change a bin’s color and name: simply select a color and type a name for your bin.
- Number of contigs, length, Comp. Red.: (only visible when using anvi-interactive)various information regarding the bin, like the number of contigs it contains, the cumulative length, the completion and redundancy estimation.
- Gene Clusters and Gene Calls: (only visible when using anvi-display-pan), number of gene clusters and cumulative number of gene calls included in the bin selection.
- Edit color for multiple bins: allow you to change the color of multiple bins. By default it will change the color for all bins, but you can use the text box to search for bins with specific letters/numbers and automatically give them the same color.
- Load / Store bins collection: when you are satisfied with your collection of bins, you can save them. You can have as many collections of bins as you want and you can load them later.
- Generate a static summary page: runs anvi-summarize in the background with the collection of your choice. For more information check anvi-summarize.
- Recalculate / Show Taxonomy for Bins: (only visible when using anvi-interactive) related to the top most checkbox “Realtime taxonomy estimation for bins”. If you ran anvi-run-scg-taxonomy, then anvi’o will be able to display realtime taxonomy estimation of your bin based on the consensus taxonomy of annotated Ribosomal Proteins included in the bins. Not available if you did not run anvi-run-scg-taxonomy and if there are no compatible Ribosomal Proteins. When clicking on the Show Taxonomy for Bins, you can get a detailed view of individual Ribosomal Proteins gene per bins, and their individual taxonomy estimation as well as the bin’s consensus taxonomy estimation. It is a great complement to the completion/redundancy estimation when assessing bin’s completeness and potential contamination.
Data tab
The data tab displays the value of items underneath the mouse pointer while the user browses the tree.
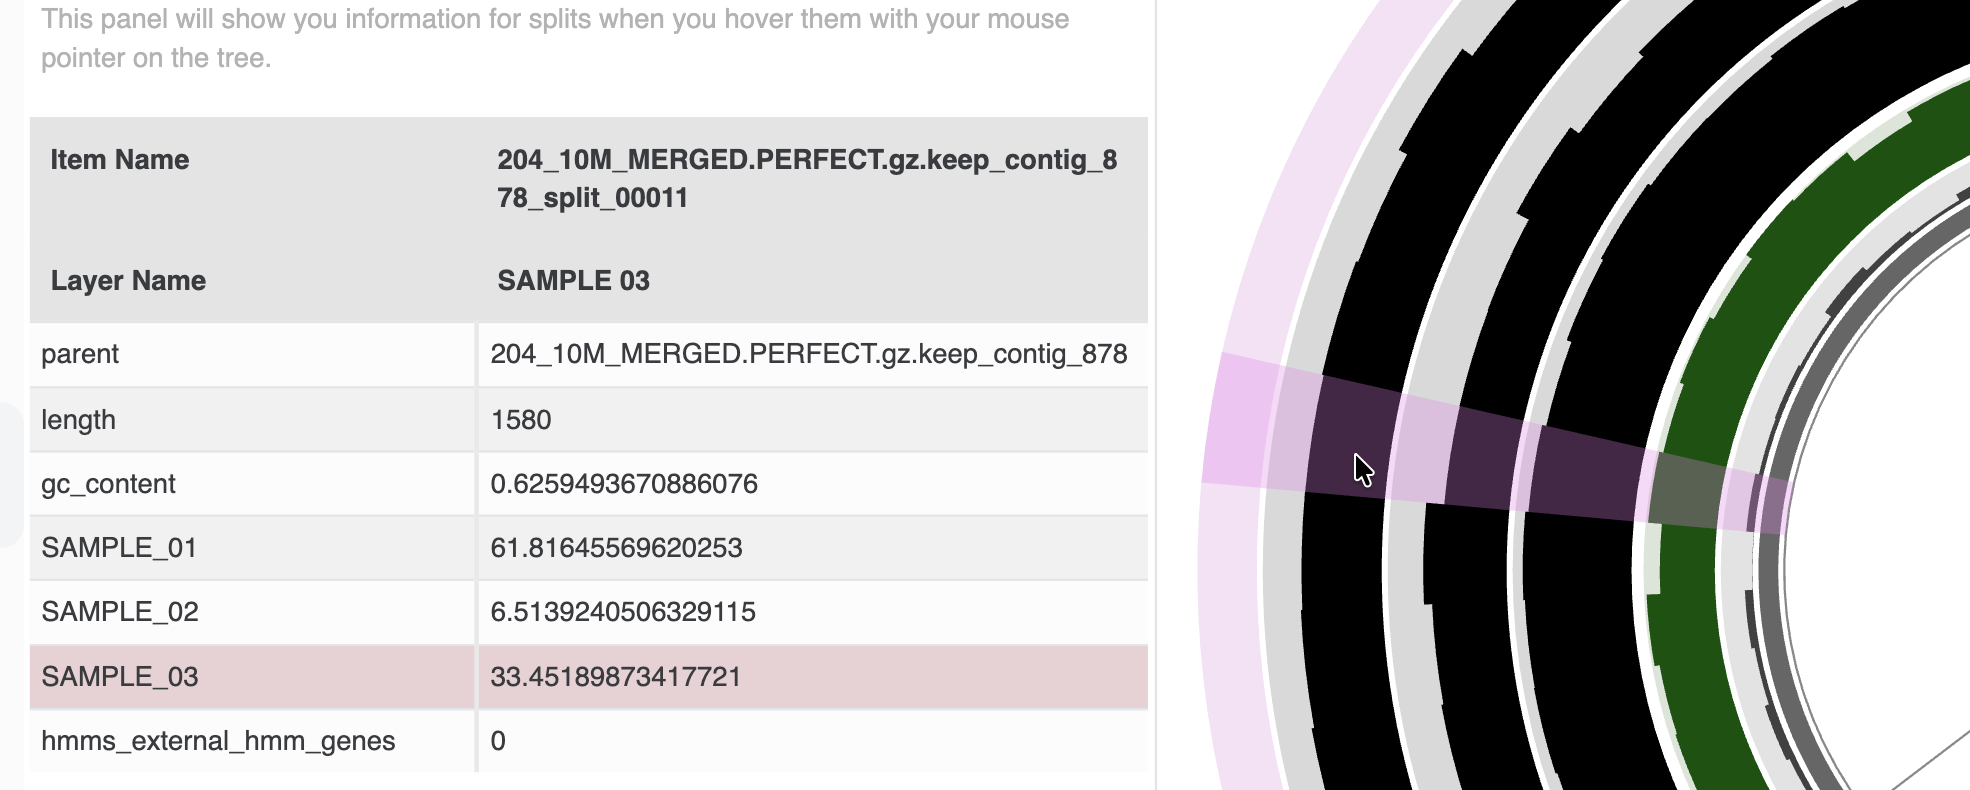
Displaying the numerical or categorical value of an item shown on the tree is not an easy task. We originally thought that displaying pop-up windows would solve it, but besides the great overhead, it often became a nuisance while browsing parts of the tree. We could show those pop-up displays only when use clicks on the tree, however click-behavior is much more appropriate to add or remove individual items from a bin, hence, it wasn’t the best solution either. So we came up with the ‘data tab’. You have a better idea? I am not surprised! We would love to try improve your experience: please enter an issue, and let’s discuss.
Notes tab
- The notes tab is a flexible, multipurpose space where users can,
- Store notes, comments, and any other stray items related to their project, in a feature-rich markdown environment.
- Display context, references, reproducibility instructions, and any other salient details for published figures.
Search tab
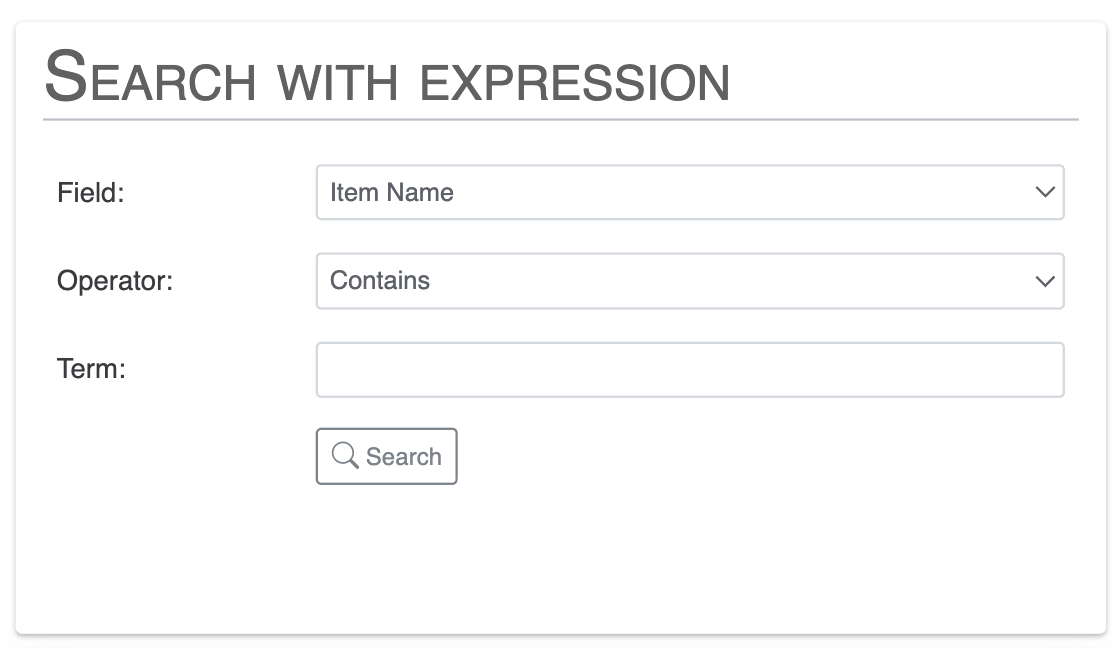
Search with expression
The first section of the search tab allows you to search using any term/expression in a multitude of fields. These fields include the items’ name, which are contigs/splits when using anvi-interactive, or gene clusters when using anvi-display-pan. You can also select a layer of interest and search for every item matching an expression, like finding all contigs with a mean coverage above 10x, find gene clusters with a min AAI under 50%, etc.
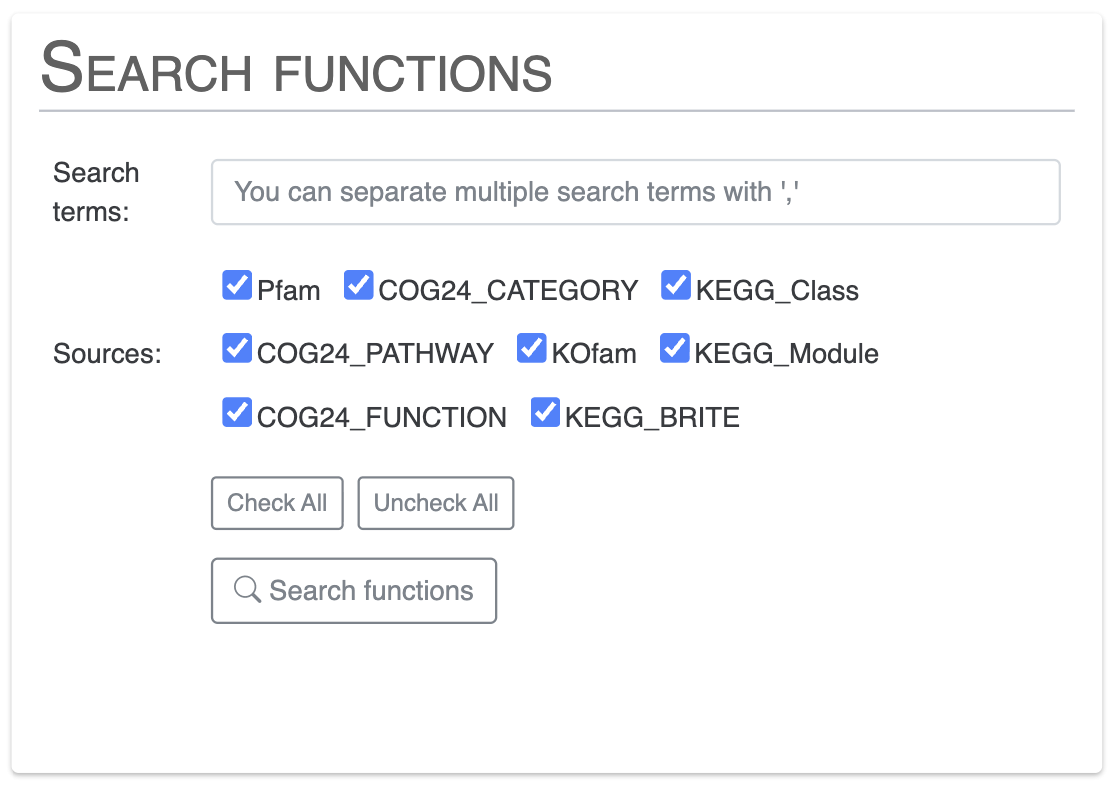
Search functions
In this section, you can search for functional annotations across all functional annotation sources available in your databases. You can search for one or multiple terms, and select specific annotation sources.
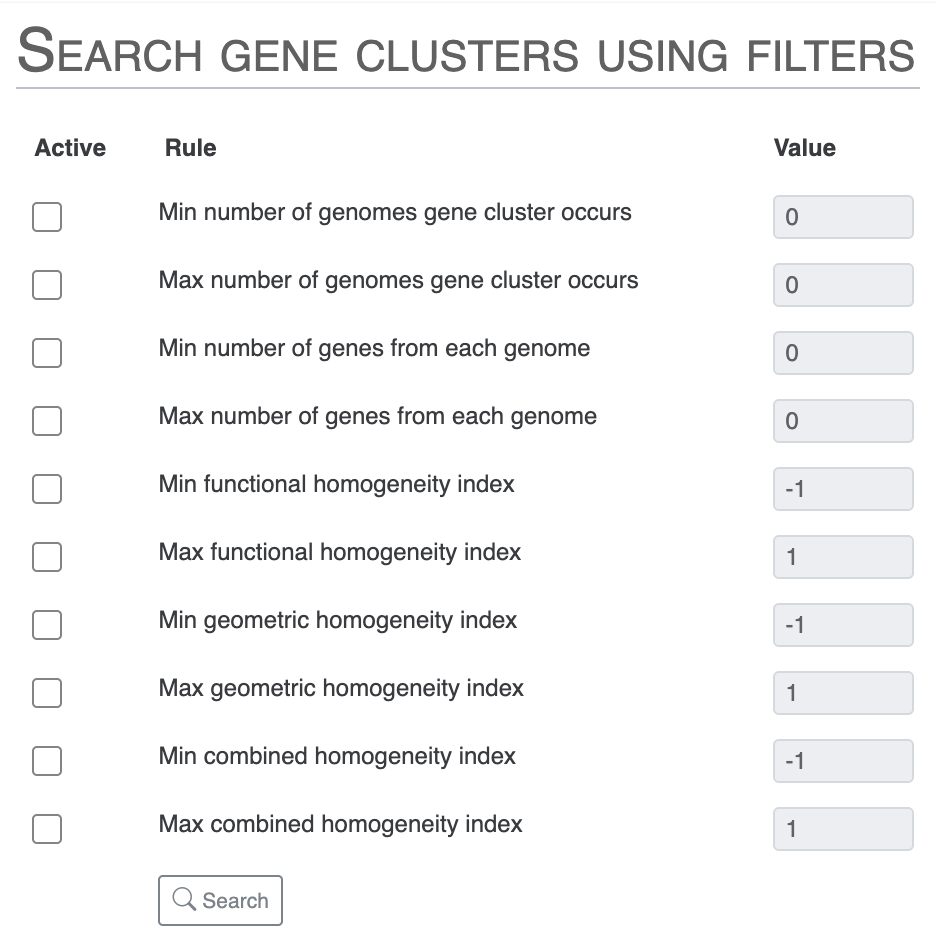
Search gene clusters using filters
This is specific to anvi-display-pan. There you can select gene clusters based on multiple filters.
Display the search results
At the very bottom of the Search tab are a few buttons to view and explore the results of your search:
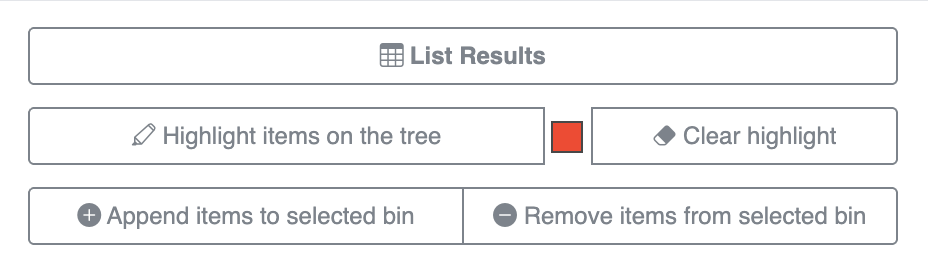
- List Results: there you can choose to display the detail of the searched items. By clicking on that button, a table will appear with the details of the items matching your search.
- Highlight the search: you can highlight the items matching the search by clicking, change the color of the highlight and remove any existing highlight.
- Append/Remove items from selected bin: you can choose to add the items matching your search to the current bin, or to remove them from your current bin.
News tab
The news panel provides information and external links tracking major Anvi’o releases and development updates. (We don’t update this news section very often).
Anvi’o tab
In this tab, you will find the links to the authors, the project page, the github’s list of issues, how to cite anvi’o, an access to the discord server and the github repository.
Interactive interface tips + tricks
Here are some small conveniences that may help the interface serve you better (we are happy to expand these little tricks with your suggestions).
-
You can zoom to a section of the display by making a rectangular selection of the area while the pressing the shift button.
-
You can click an entire branch to add items into the selected bin, and remove them by right-clicking a branch.
-
If you click a branch while pressing the
CommandorCTRLbutton, it will create a new bin, and add the content of the selection into that bin. -
Tired of selecting items for binning one by one? right-click on an item and select Mark item as ‘range start’ to set an ‘in point’, then right-click on another item and select Add items in range to active bin or Remove items in range from any bin to manipulate many items with few clicks. Nice!
-
By pressing
1,2,3,4,5,6,7and8you can go between Main, Options, Bins, Data, Notes, Search, News and Anvi’o tabs!
Keyboard shortcuts
The interactive interface recognizes a handful of keyboard shortcuts to help speed up your workflow
- The
Skey toggles the Settings panel - The
Dkey triggers a redraw of your visualization - The
Tkey toggles showing the Title panel - Keys
1through8will toggle between tabs within the Settings panel, granted the Settings panel is currently shown. CTRL+ZandCTRL+SHIFT+Zwill undo or redo bin actions, respectively.
Edit this file to update this information.